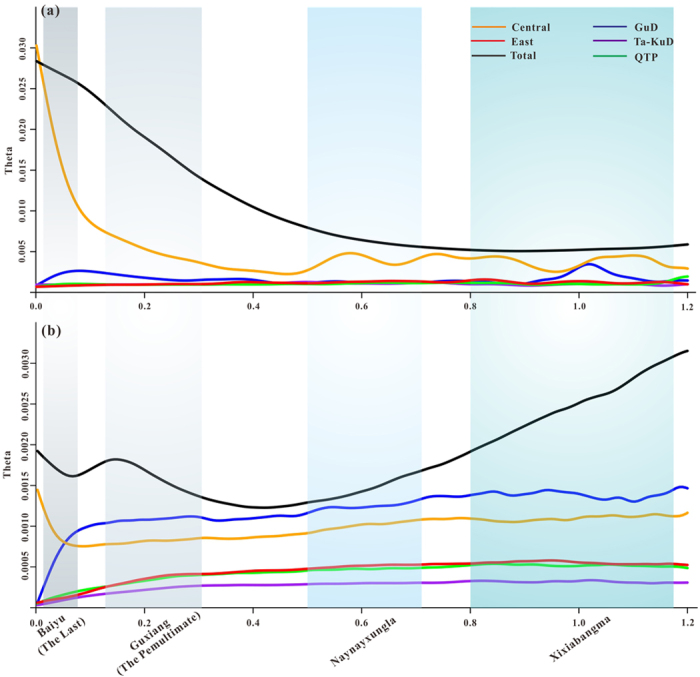
Figure 4. Skyline plot estimated by Migrate-n for each group of A. squarrosum: x-axis, time in million years ago; y-axis, theta (θ = 4 μNe for nrITS; θ = 2 μNe for cpDNA).

Letters after horizontal lines with different colours represent the skyline plots for the five groups and the whole populations, respectively.
