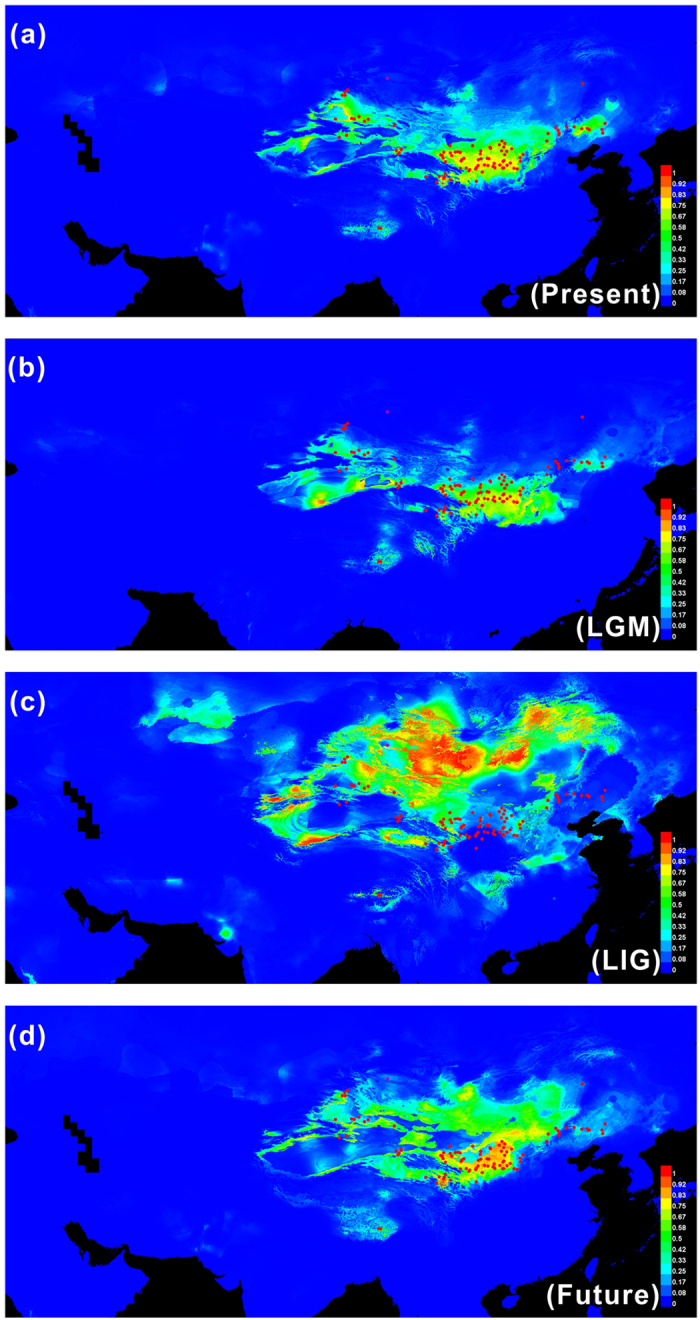
Figure 5. Predicted distributions of A. squarrosum.

The red plots represent the 124 localities, including our own collection sites, and records from the Chinese Virtual Herbarium were used to construct the models. These figures originated from the software packages of MAXENT version 3.3.3, the environmental variables originated from from the WorldClim database version 1.4 (1950–2000, http://www.worldclim.org/), and then modified by Q,C.J. with CorelDraw X6 (Corel Corporation, Ottawa, Canada).
