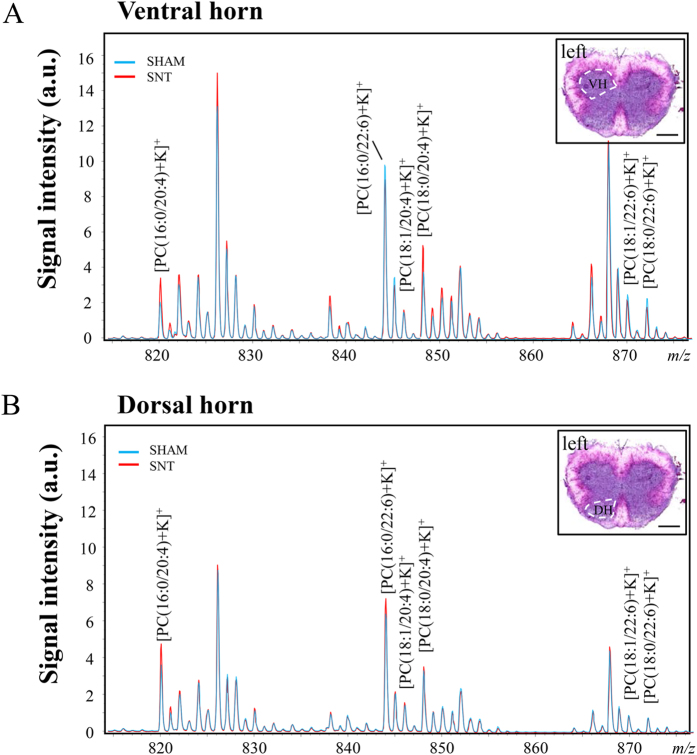
Figure 1. Comparison of mass spectra of PUFA-PCs in sham and SNT mice spinal cords, 7 days after surgery.
(A) Comparison of mass spectra of PUFA-PCs in ventral horn between sham (blue) and SNT (red). (B) Comparison of mass spectra of phospholipids in the dorsal horn in sham and SNT. AA-PCs: [PC(16:0/20:4)+K]+ (m/z 820.5), [PC(18:1/20:4)+K]+ (m/z 846.5), and [PC(18:0/20:4)+K]+ (m/z 848.5) and DHA-PCs: ([PC(16:0/22:6)+K]+ (m/z 844.5), [PC(18:1/22:6)+K]+ (m/z 870.5), and [PC(18:0/22:6)+K]+ (m/z 872.5) shown in A and B were the target phospholipids in the present study. Insets are the HE staining of mouse spinal cord illustrating the region of interest, ventral horn in (A), dorsal horn in (B). VH, ventral horn; DH, dorsal horn. Scale bar: 500 μm.

