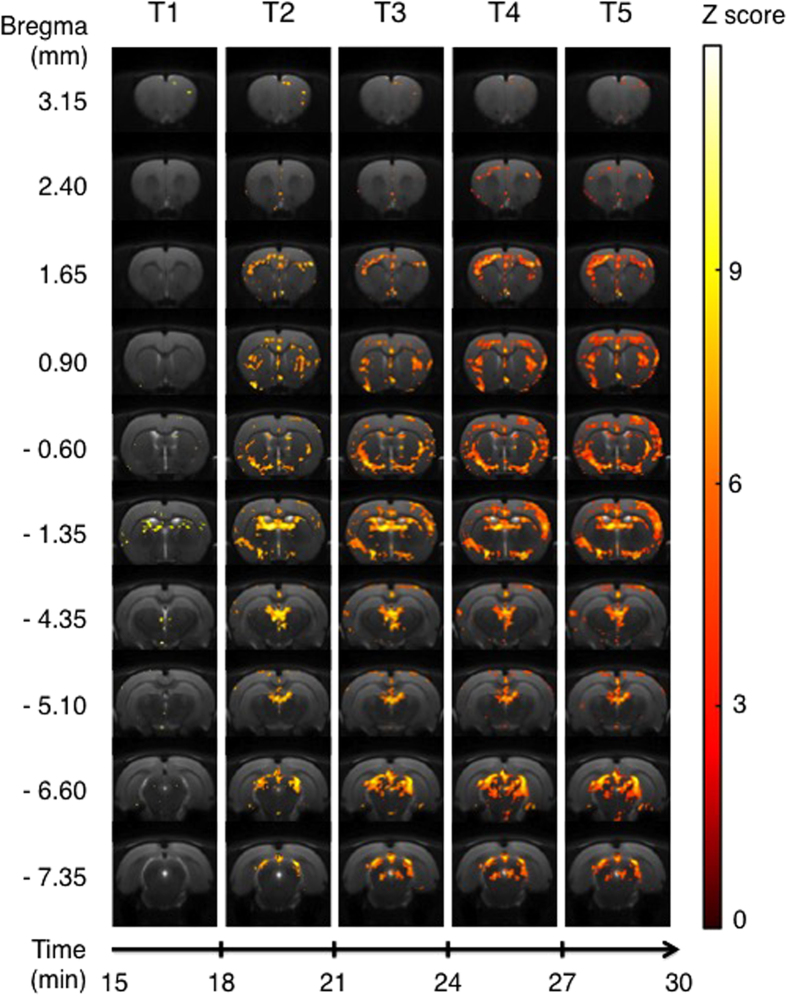
Figure 4. Areas of significant activation following i.p. injection of F13714.
Data are processed in successive 3-min blocks from onset of injection (T1) to the end of acquisition (T5). Statistically significant areas for each time bin, for 9 rats, using an ANOVA for F13714 minus saline injection (p < 0.001 uncorrected). Z score in color scale, bregma coordinates on the left scale, time scale start at T1 (15 minutes after the beginning of the MRI session).

