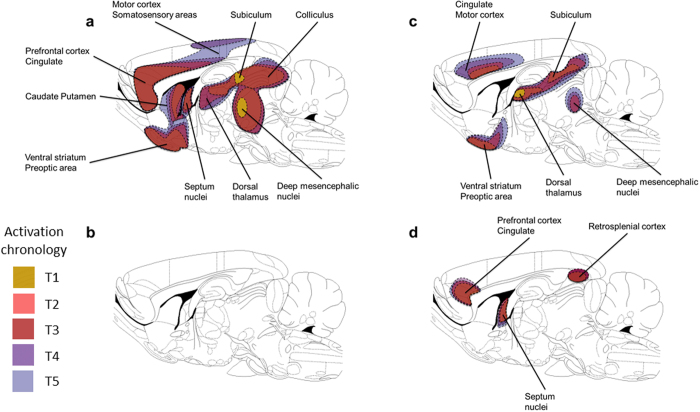
Figure 6. Topography of the main activated regions after injection of 5-HT1A ligands.
(a) 8-OH-DPAT as a prototypical 5-HT1A agonist. (b) MPPF as a 5-HT1A “silent antagonist” (without any activation). (c) F13714 as a 5-HT1A biased agonist. (d) F15599 as a 5-HT1A biased agonist. Colours indicate the chronology of activation (yellow, T1; orange, T2; red, T3; purple, T4; blue, T5).

