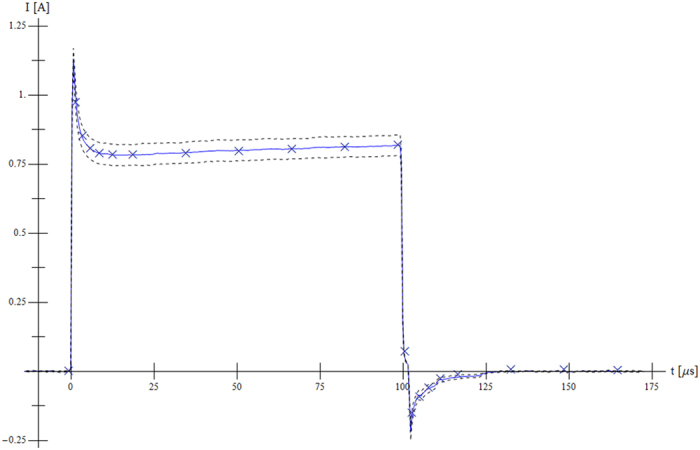
Figure 3. In silico experiment fits ex vivo measurements.

Numerical simulation (“×” marks) of current with respect to measurement (blue solid line) with standard deviation (dashed line) in the case of the first pulse from Sequence 1 (500 V, short pulse, high pulse repetition frequency).
