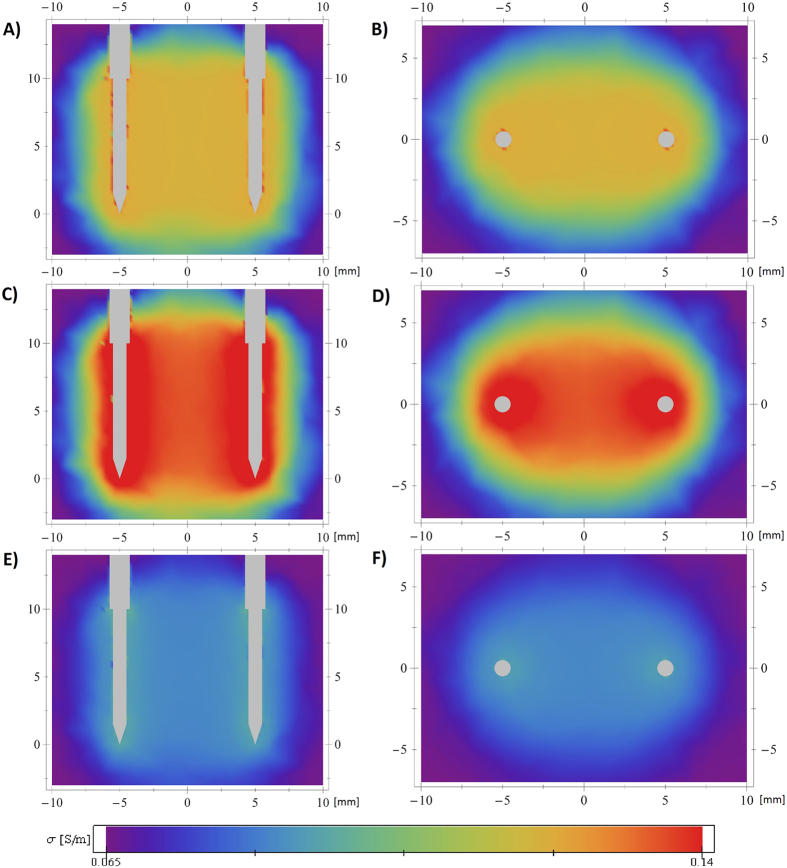
Figure 5. Spatial and temporal evolution of tissue conductivity during application of the first pulse.
Sequence 4 (750 V, short pulse, high pulse repetition frequency) and parameters from Run1 were used. Vertical (A,C,E) and horizontal (B,D,F) cross sections over the simulation domain, coloured by calculated tissue conductivity σ, at different stages of pulse application. (A,B) show the beginning of the pulse (when the applied voltage reaches the prescribed value), (C,D) the end of the pulse and (E,F) the beginning of the next pulse (maximum relaxation).

