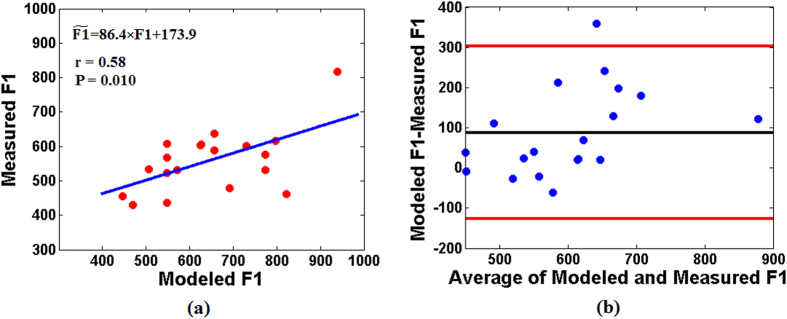
Figure 4. Agreement between modeled and measured F1 of the snoring sounds.
(a) Scatterplot of the F1 of the recorded snoring sounds (measured F1) and F1 simulated from the upper airway tube model (modeled F1) along with the linear regression equation of modeled and measured F1, where  is the measured F1. (b) Bland–Altman plot, the black line indicates the average difference and the red lines present the mean ± 1.96 of standard deviation (boundaries of 95% confidence interval) of the difference between modeled and measured F1.

