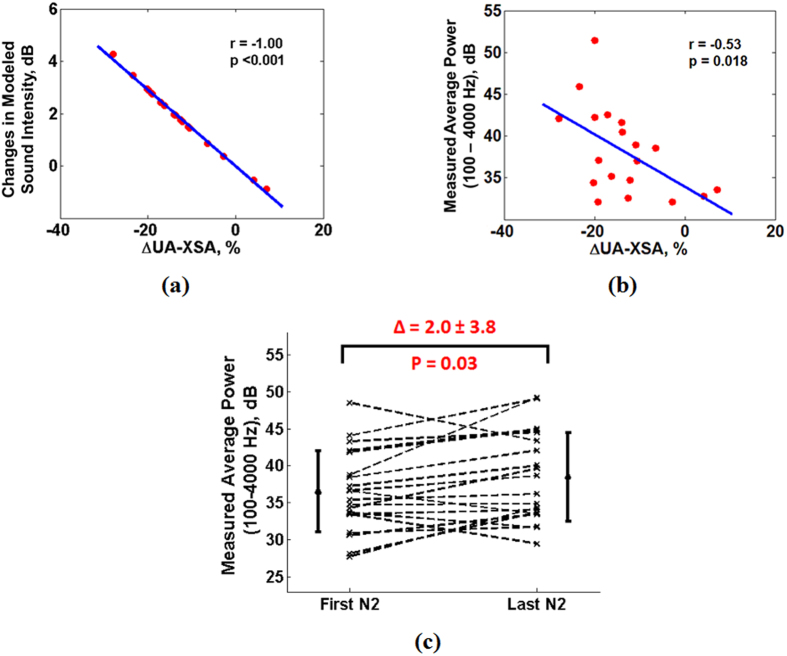
Figure 6. Relationship between changes in upper airway cross sectional area (UA-XSA) during sleep and snoring sounds intensity (assessed by Pearson Correlation Coefficients).
(a) Result obtained from the modeled snoring intensity: narrowing in the UA-XSA was strongly correlated with increases in the intensity of the sound; (b) Result obtained from the measured snoring intensity: narrowing in the UA-XSA during sleep was significantly correlated with increases in the measured average power of snoring sounds (calculated over the entire sleep duration) within 100–4000 Hz frequency range; (c) Results obtained from the measured snoring intensity: there were significant increases in the measured average power snoring sounds from first part to the last part of the N2 sleep stage (assessed by paired t-test).

