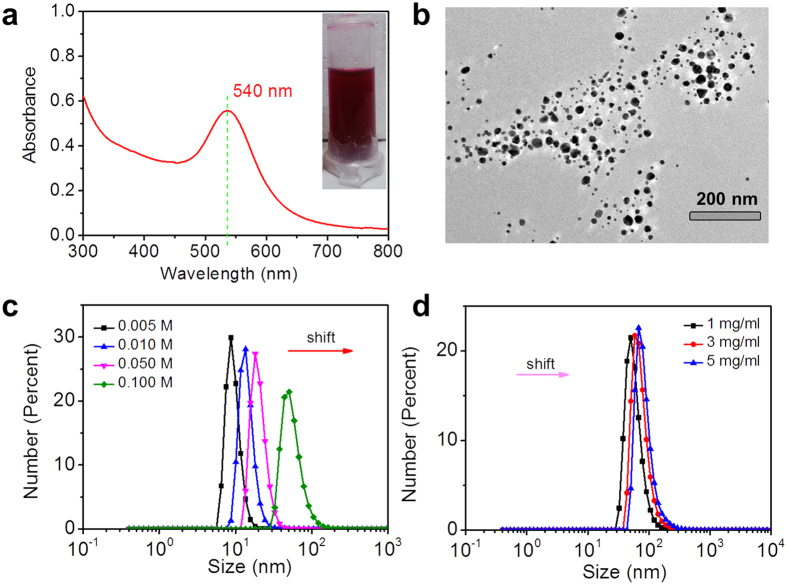
Figure 3.
(a) UV-vis absorption spectrum of gold-collagen nanoconjugates and photograph of an aqueous solution containing the nanoconjugates (inset). (b) TEM images of the nanoconjugates. (c) DLS size distribution diagrams of nanoconjugates, which were prepared with the final chloroauric acid concentration 0.005 mM, 0.01 mM, 0.05 mM and 0.1 mM, respectively. (d) DLS size distribution diagrams of nanoconjugates prepared with 0.1 mM chloroauric acid concentration and the collagen concentration 1 mg mL−1, 3 mg mL−1 and 5 mg mL−1, respectively.

