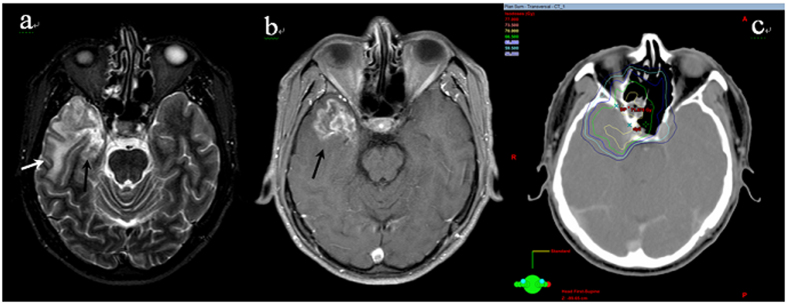
Figure 1.
An example of TLI lesion showing (a) homogeneous high signal area in the white matter on T2-weighted images (white arrow) and the medial necrosis (black arrow) (b) contrast-enhanced lesion on postcontrast T1-weighted MR images with internal necrosis (black arrow) (c) corresponding isodose lines.

