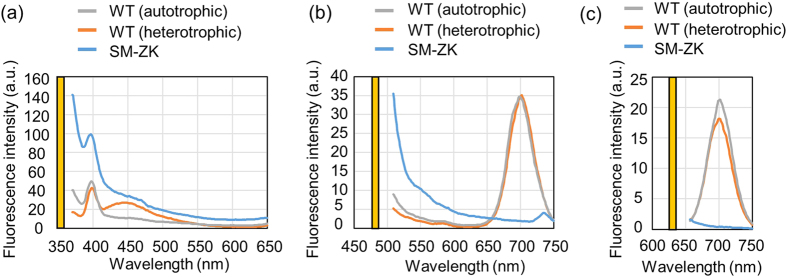
Figure 1. Characterization of the autofluorescence of E. gracilis cells.
(a–c) Autofluorescence spectrum of the WT (Z strain) in the autotrophic and heterotrophic cultures and the chloroplast-less SM-ZK strain in the heterotrophic culture. The wavelength of the excitation laser is 350 nm (a), 488 nm (b), and 635 nm (c). The yellow bars indicate the wavelength of the excitation laser.

