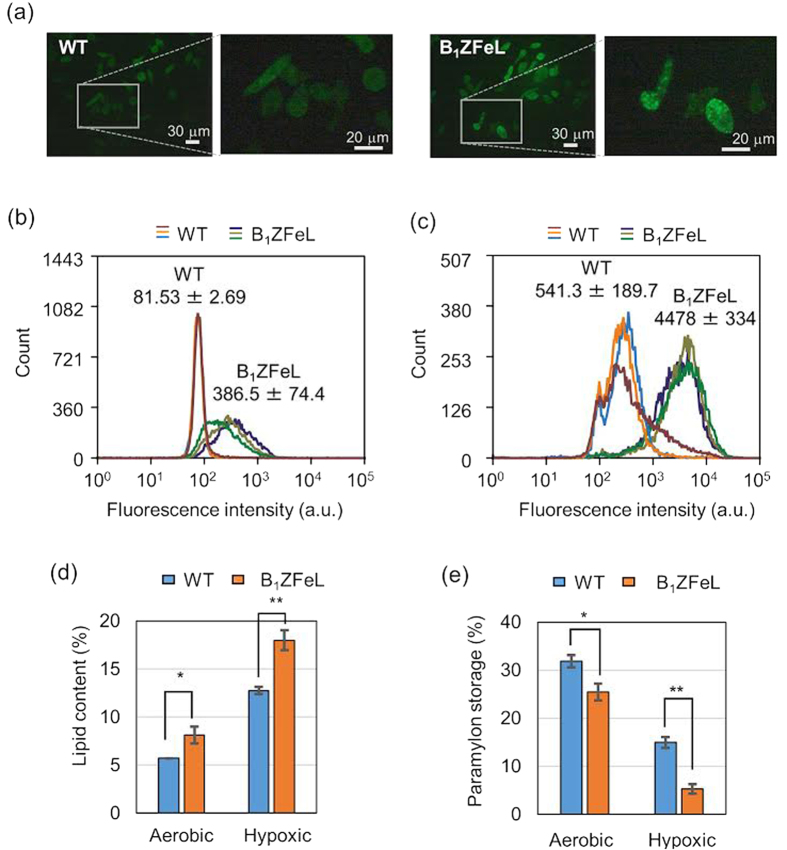
Figure 4. Characterization of the lipid-rich strain B1ZFeL.
(a) Fluorescence images of BODIPY505/515-stained WT (Z strain) and B1ZFeL cells in the aerobically heterotrophic culture. (b,c) Histogram of the BODIPY505/515-stained WT and B1ZFeL cells. The cells without (b) and with (c) hypoxic incubation were stained with BODIPY505/515 and analyzed by FACS analysis. The fluorescence intensity is the strength of the light that passed through the 529/28 bandpass filter. The three histograms represent the results of independent cultures for each strain. The values in the plots are the average fluorescence value of each strain with the standard error of the mean N = 3. (d,e) Lipid (d) and paramylon (e) contents of the WT and B1ZFeL in the heterotrophic culture with and without hypoxic incubation. N = 3. *p < 0.05, **p < 0.005, t-test with Bonferroni’s correction.

