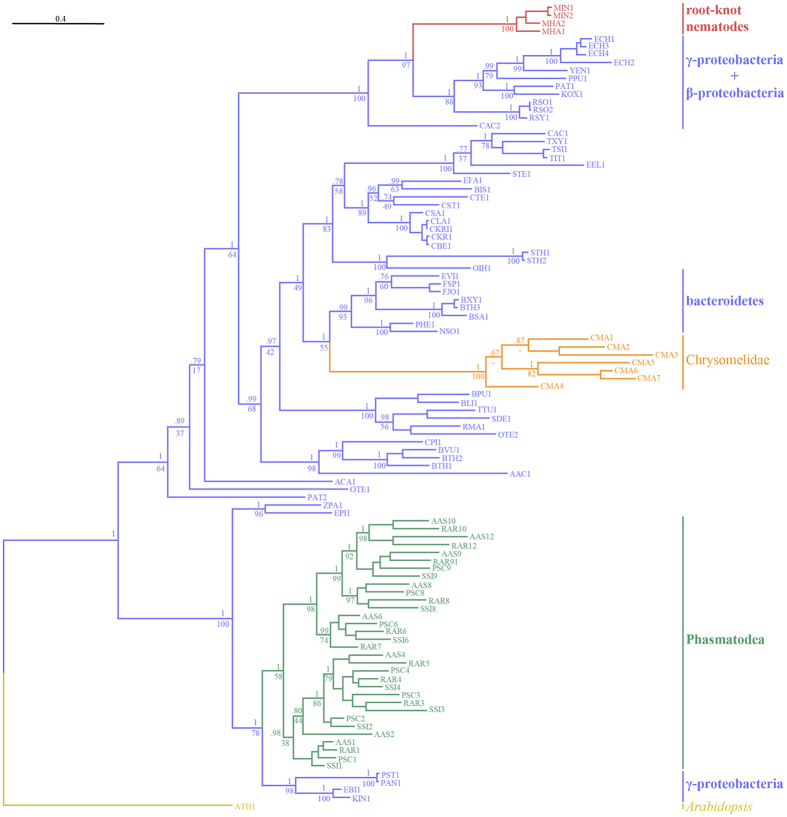
Figure 3. Phylogeny of the GH28 proteins.
To minimize the size of the tree, only pectinases from the four exemplar species of Phasmatodea used in the expression assays are included in this figure, with one representative from genes with multiple alleles. Gene tree topology obtained from the Bayesian analysis, (posterior probability support at nodes) chosen as a reference topology. Bootstrap values obtained from the ML analysis are indicated at the corresponding nodes below posterior probability values. The tree is represented as a cladogram with branch lengths and rooted with the A. thaliana sequence (GenBank Accession Number NP_850359.1) as outgroup. Branches are colored in violet if derived from bacterial sequences, in red if derived from nematode sequences, in orange if derived from beetle sequences, in green if derived from Phasmatodea sequences, and in yellow for the plant sequence outgroup. Species name abbreviations are indicated in Table S2.

