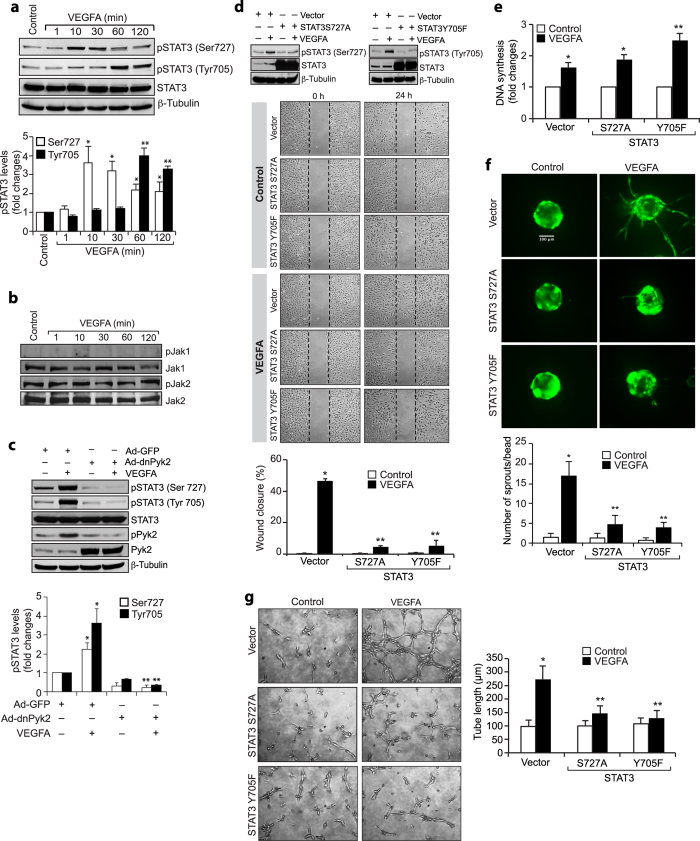
Figure 3. Pyk2 mediates STAT3 activation in VEGF-induced HRMVEC angiogenic responses.
(a,b) An equal amount of protein from control and various time periods of VEGFA (40 ng/ml)-treated HRMVECs was analyzed by Western blotting for pSTAT3, pJak1 and pJak2 levels and the blots were reprobed for total STAT3, Jak1, Jak2 or β-tubulin for normalization. (c) Cells were transduced with Ad-GFP or Ad-dnPyk2 (40 moi), growth-arrested, treated with and without VEGFA (40 ng/ml) for 10 min or 60 min, cell extracts were prepared and analyzed by Western blotting for pSTAT3 and pPyk2 levels and the blots were reprobed for total STAT3, Pyk2 or β-tubulin to show the over expression of dnPyk2 or normalization. (d) Upper panel: Cells were transfected with empty vector or mutant STAT3 (STAT3S727A or STAT3Y705F), growth-arrested, treated with and without VEGFA (40 ng/ml) for 10 min or 60 min, cell extracts were prepared and analyzed by Western blotting for pSTAT3 levels and the blots were reprobed for total STAT3 or β-tubulin to show the over expression of mutant STAT3 or normalization. Lower panel: All the conditions were the same as in upper panel except that after growth-arrest cells were subjected to VEGFA-induced cell migration assay. (e–g) All the conditions were the same as in panel d except that after growth-arrest cells were subjected to VEGFA-induced DNA synthesis (e), sprouting (f) or tube formation (g) assays. The bar graphs represent quantitative analysis of three independent experiments. The values are presented as Mean ± SD. *p < 0.01 vs control or vector or Ad-GFP; **p < 0.01 vs vector ± VEGFA or Ad-GFP ± VEGFA.

