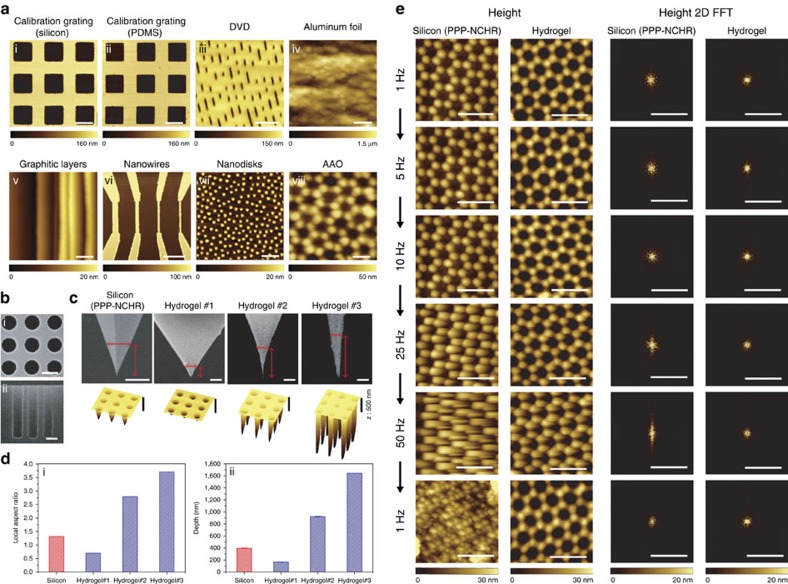
Figure 5. Noncontact mode imaging performance of hydrogel probes and comparison with silicon probes.
(a) Noncontact mode height images of calibration gratings (silicon and PDMS replica), digital versatile disk media with written data bits, nanowires, aluminium foil, graphitic layers, nanodisks and an AAO sample (70 nm pore diameter). Scale bars are 5, 5, 5, 10, 1, 5, 0.4 and 0.1 μm for (i–viii), respectively. (b) Top (i) and side (ii) view of SEM images of cylindrical pores with 1 μm diameter, 1.4 μm pitch and 5 μm depth. The side view was taken after the sample was cleaved. Scale bars are 1 μm. (c) Scanning electron microscopy (SEM) images showing tip apex regions of commercial silicon (PPP-NCHR, Nanosensors) and fabricated hydrogel (length, width and thickness: 200, 50 and 20 μm) probes and corresponding 3D representations of noncontact height images for the deep cylindrical pores. All scale bars are 1 μm. (d) Local aspect ratio (i) and maximum depth (ii) measured with silicon and hydrogel probes. (e) Height images for another AAO sample (35 nm pore diameter) taken by commercial silicon (PPP-NCHR, Nanosensors) and fabricated hydrogel (length, width and thickness: 170, 50 and 20 μm) probes at 1, 5, 10, 25, 50 and 1 Hz, respectively. Height images are 2D fast Fourier transformed (2D FFT) to quantitatively compare image distortions and artifacts. Scale bars for height and 2D FFT images are 100 nm and 200 μm−1, respectively. The same colour bars are used for height and 2D FFT images, respectively.

