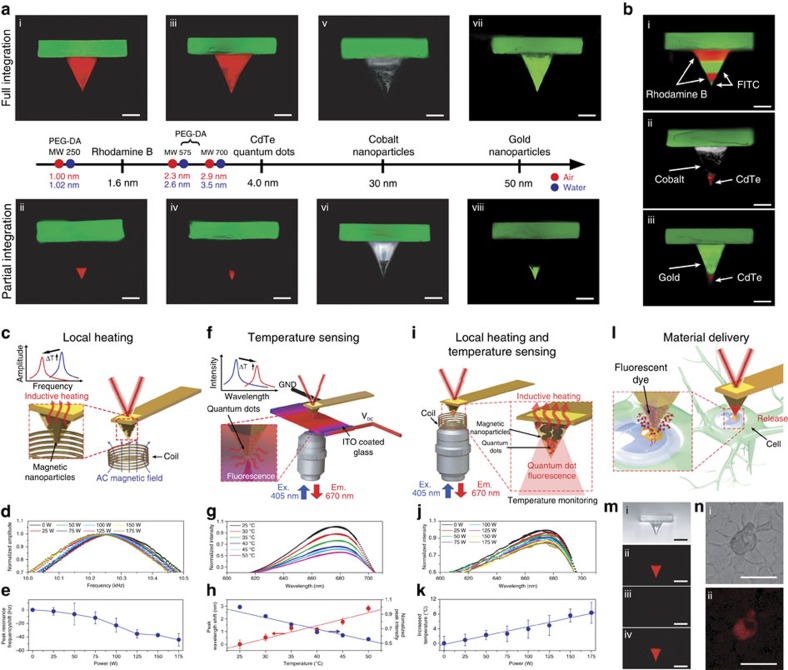
Figure 8. Programming of multifunctional hydrogel nano-probes.
(a) Hydrogel nano-probes with integrated functional nanomaterials achieved through materials encapsulation. Depending on the encapsulated nanomaterial, the tip structure is composed of PEG-DA with varying MW as specified: (i, ii) Rhodamine B dye (MW 575), (iii, iv) cadmium telluride (CdTe) quantum dots (MW 700), (v, vi) cobalt (Co) nanoparticles (MW 250) and (vii, viii) gold (Au) nanoparticles (MW 700). The mesh sizes of PEG-DA monomers with different MWs are presented. All scale bars are 10 μm. (b) Multifunctional hydrogel nano-probes with sequential loading of FITC and Rhodamine B (i), CdTe quantum dots and Co nanoparticles (ii), and CdTe quantum dots and gold nanoparticles (iii). All scale bars are 10 μm. (c) Schematic for local inductive heating. (d) Normalized amplitude spectra of a hydrogel nano-probe with a Co nanoparticle-embedded tip under induction heating in water. (e) Resonance frequency shift as a function of the input power. (f) Schematic for local temperature sensing via fluorescence quenching of quantum dots. (g) Fluorescence spectra from a hydrogel nano-probe with a CdTe quantum dot-embedded tip in contact with an ITO-coated glass substrate under Joule heating in water. (h) Peak wavelength shift and the normalized peak intensity as a function of the temperature at the tip contact point. (i) Schematic for a dual function hydrogel nano-probe for local heating and temperature sensing. (j) Fluorescence spectra from a hydrogel nano-probe with sequentially embedded CdTe quantum dots and Co nanoparticles under induction heating. (k) Temperature increase as a function of the power applied to the induction coil. (l) Schematic for localized materials delivery. (m) Bright-field and fluorescence microscopy images of a hydrogel nano-probe before (i) and after (ii) the first loading as well as after the first delivery (iii) and after the second loading (iv), respectively. All scale bars are 20 μm. (n) Bright-field optical microscopy image (i) and fluorescence microscopy image (ii) for a breast cancer cell (MCF-7) demonstrating localized delivery of Rhodamine B dye. Scale bars are 10 μm. All error bars represent the s.d. of the mean with N=3 measurements.

