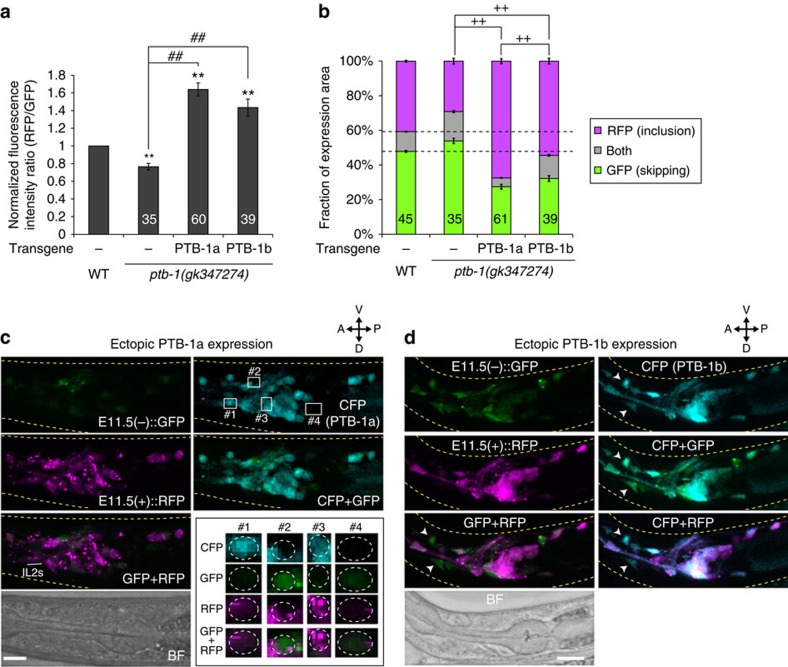
Figure 9. Ectopic PTB-1 expression promotes exon 11.5 inclusion in the nervous system.
(a,b) Normalized fluorescence intensity ratios of RFP to GFP (a) and fractions of GFP and RFP expression (b) of the neuronal exon 11.5-skipping/inclusion reporter in the ptb-1(gk347274) mutant and in those expressing either PTB-1a or PTB-1b under the casy-1 promoter. Data were normalized by the averaged values in the wild-type worms (n⩾33, a). The n values are shown in each bar. Error bars represent s.e.m. **P<0.01, different from wild type; ##P<0.01, different from each other; ++P<0.01, comparison of RFP-positive fractions, two-tailed t-test with Bonferroni correction. (c,d) Maximum intensity projection expression images of the neuronal exon 11.5-skipping/inclusion reporter in the ptb-1(gk347274) mutant expressing PTB-1a (c) or PTB-1b (d) under the casy-1 promoter. CFP is co-expressed along with PTB-1 from a polycistronic pre-mRNA. As PTB-1 was expressed from extrachromosomal arrays (Supplementary Table 4), they exhibited mosaic expression patterns. High-magnification views of four regions depicted in the CFP image (c, top right) are shown in the bottom right inset in c. The areas surrounded by dotted lines indicate neuronal cell bodies with (#1 and 3) or without (#2 and 4) PTB-1a (CFP) expression (c). Arrowheads in d indicate neuronal cell bodies that express E11.5(−)::GFP, but not E11.5(+)::RFP, despite PTB-1b (CFP) expression. L1/L2 larvae were used for the analyses. Scale bars, 10 μm.

