
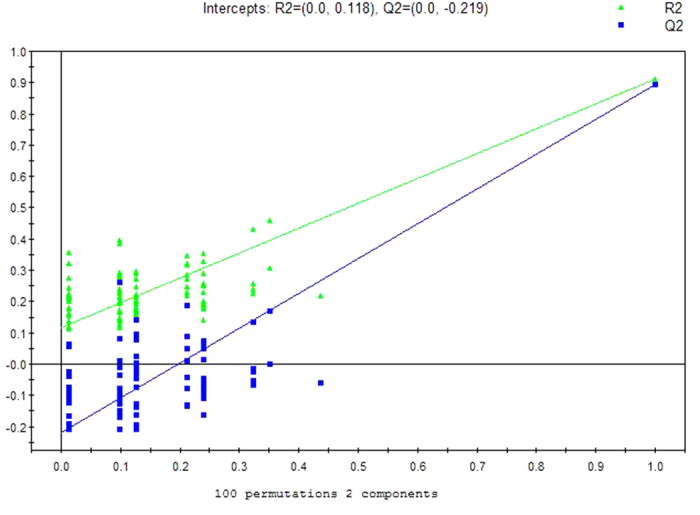
Figure 3. OPLSDA validation plot intercepts for breath samples from ALS Patients versus CSM Controls: R2 = (0.0, 0.118); Q2 = (0.0, −0.219).
Official websites use .gov
A
.gov website belongs to an official
government organization in the United States.
Secure .gov websites use HTTPS
A lock (
) or https:// means you've safely
connected to the .gov website. Share sensitive
information only on official, secure websites.