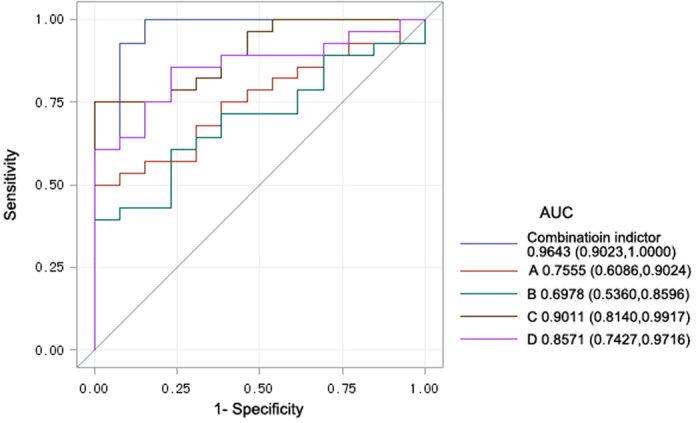
Figure 4. ROC curves of each potential biomarker (A: carbamic acid, monoammonium salt, B: l-alanine ethylamide, (S)-, C: guanidine, N,N-dimethyl-, D: phosphonic acid, (p-hydroxyphenyl)-) and the combined index, with AUC and 95% confidence intervals.

The straight line represents an AUC of 0.5.
