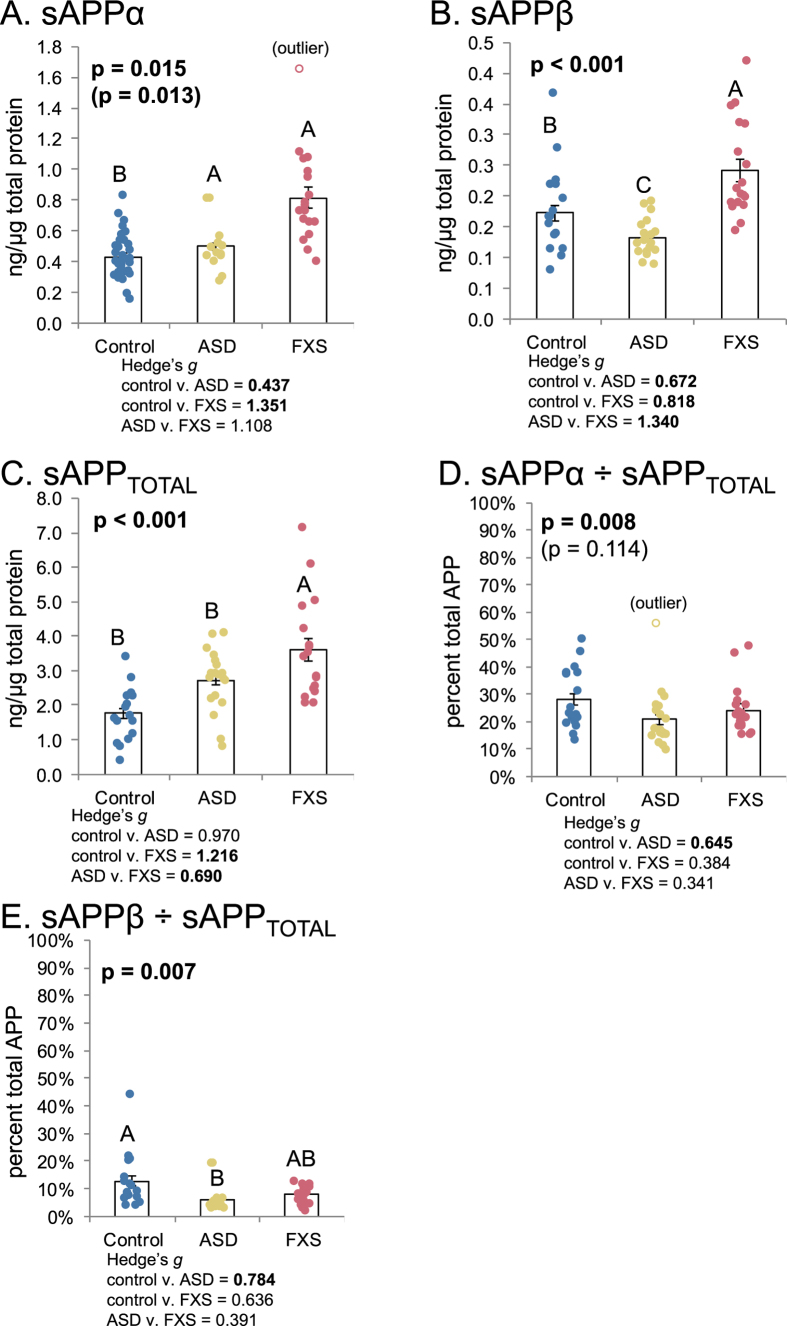
Figure 2. Levels of various Soluble APP (sAPP) isoforms in ASD and FXS plasma.
Plasma from age-matched controls, autistic subjects, and subjects with Fragile X was collected and albumin-subtracted as described in the text. ELISA was performed for sAPPα, sAPPβ and total sAPP in plasma. Generalized linear models (glm) were run as described in the text and ANOVAs run on the glm vs. a null model. Each model was subject to a Bonferroni-corrected test for outliers, and glm, repeated omitting any outlier. The p value(s) for any glm including the outlier are in parentheses. Each glm with p ≤ 0.05 was followed by simultaneous pairwise comparisons (Tukey’s). Diagnoses sharing a letter do not significantly differ. Hedge’s g standardized effect sizes were also calculated for each pairwise comparison. Specific g are reported beneath each chart. Comparisons with Tukey’s p ≤ 0.05 are in boldface. (A) sAPPα levels. FXS and ASD significantly differ from controls. (B) sAPPβ levels. FXS is significantly higher than control. ASD is significantly lower than control. (C) Total APP levels in plasma. Overall, controls have lower levels of total measured APP than other groups, but this difference is not significant for control vs. ASD. (D) sAPPα/APPTOTAL. While the trimmed (outlier-excluded) model had overall significance, no pairwise comparisons were significant. (E) sAPPβ/APPTOTAL. Scale at 0–100% for direct comparison. ASD showed significantly lower levels of this ratio than controls. FXS overlapped the other two groups.

