
FIG. 4.
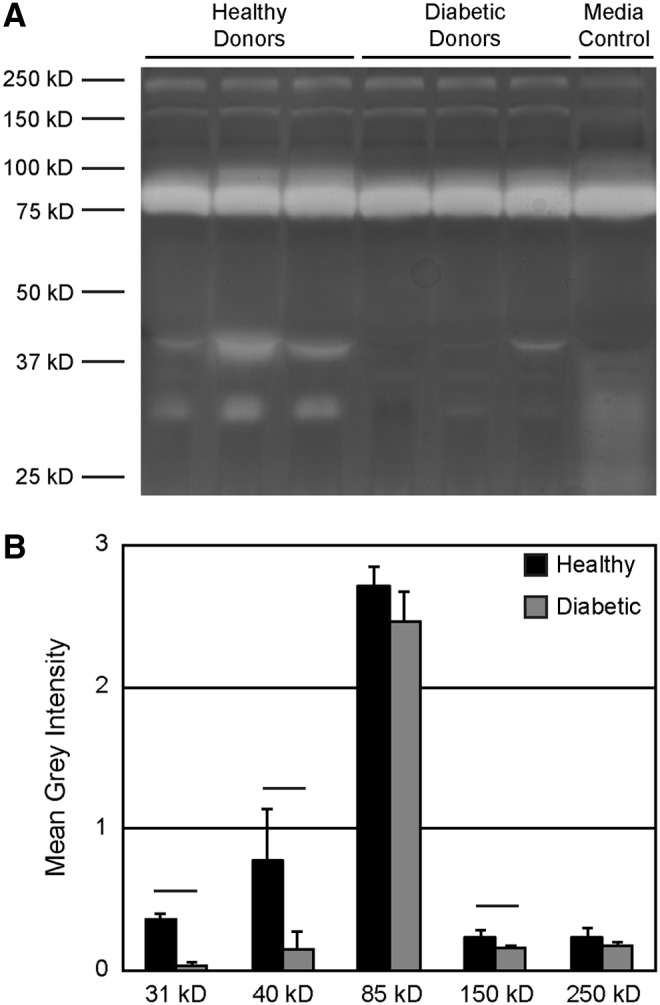
Diabetic AD-MSCs produce less fibrinolytic factors than healthy AD-MSCs. (A) Zymography was performed utilizing conditioned media from AD-MSCs from healthy or diabetic donors using acrylamide gels doped with fibrinogen. White bands indicate areas of fibrinogen degradation, several of which were more prominent when AD-MSCs from healthy donors were used. Media control = nonconditioned serum-containing media. (B) Bands were quantified using toolboxes within ImageJ; bands at 31, 40, and 150 kD were increased in healthy samples. Data are presented as mean ± SD. Black bar = statistically significant difference (p < 0.05).