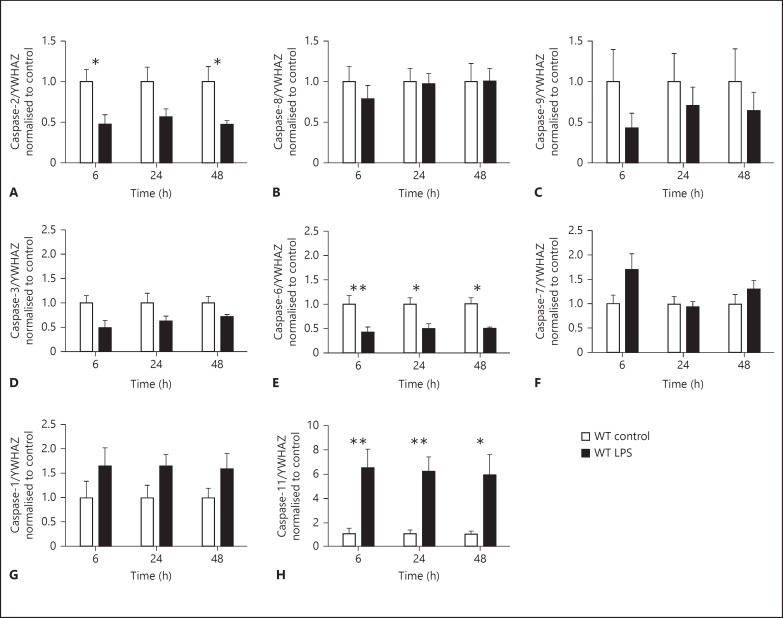
Fig. 3.
Caspase mRNA in primary microglia following LPS (10 ng/ml). Gene expression for the following caspases was assessed in WT primary microglia: initiator - caspase-2 (A), caspase-8 (B) and caspase-9 (C); effector - caspase-3 (D), caspase-6 (E) and caspase-7 (F), and inflammatory - caspase-1 (G) and caspase-11 (H). LPS-treated microglia (black bars) were normalised and compared with control (white bars) cells for each time point. Data were analysed with a two-way ANOVA (for time and treatment) and, when significant, a Sidak post hoc analysis was conducted. Data are mean ± SEM (n = 5 independent experiments). * p < 0.05, ** p < 0.01.

