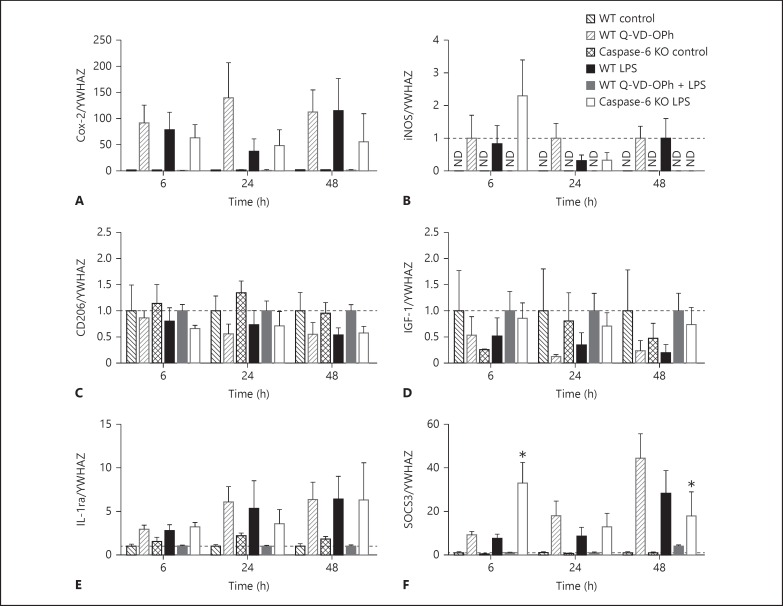
Fig. 5.
Gene expression of microglial phenotype markers in WT primary microglia following LPS (10 ng/ml), Q-VD-OPh (20 µm), Q-VD-OPh + LPS, and caspase-6 KO control and LPS. Expression of genes indicative of M1: Cox-2 (A) and iNOS (B); M2a: CD206 (C) and IGF-1 (D), and M2b: IL-1ra (E) and SOCS3 (F), was normalised to WT control (black checked bars) for WT LPS (black bars), WT Q-VD-OPh (dark grey checked bars), WT Q-VD-OPh + LPS (dark grey bars) and caspase-6 KO LPS (white bars) was normalised to caspase-6 KO control (checked bars). For iNOS (B) gene expression, only LPS-treated cells were detected, so data were normalised to WT LPS. Data were analysed with a two-way ANOVA (for time and treatment) and, when significant, a Dunnett's post hoc analysis was conducted comparing with WT LPS treatment. ND = Not detected. Data are mean ± SEM (n = 4-5 independent experiments; iNOS: n = 3-4 independent experiments). Dotted line indicates 1. * p < 0.05.

