. 2016 Mar 14;5:e13909. doi: 10.7554/eLife.13909

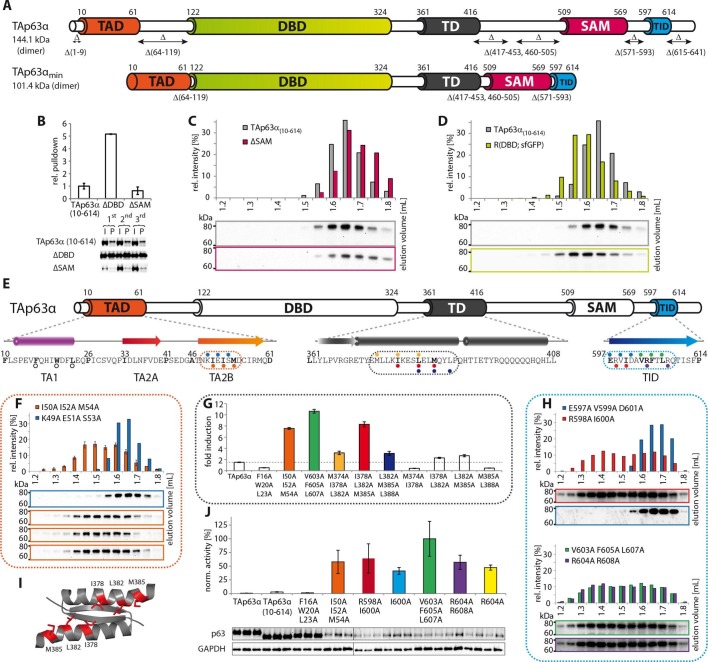
Figure 1. Mapping of structurally important regions within dimeric TAp63α.

(A) Domain organization of TAp63α: transactivation domain (TAD), DNA binding domain (DBD), tetramerization domain (TD), sterile alpha motif (SAM) domain, transactivation inhibitory domain (TID). The minimal construct of TAp63α (TAp63αmin) lacks the first 9 and the last 27 amino acids as well as linker regions between TAD and DBD (64–119), TD and SAM (417–453; 460–505) and SAM and TID (571–593). Residues 454–459 were used as a linker between TD and SAM. (B) WB and corresponding bar diagram of pull-down experiments with constructs lacking either the DBD or the SAM domain using immobilized TID. Ratio of pull-down (P) and input (I) is shown relative to TAp63α(10–614) (set to 1). Pull-downs were performed in technical triplicates and error bars denote standard deviation. (C,D,F,H) TAp63α(10–614) constructs were expressed in rabbit reticulocyte lysate (RRL) and subjected to size exclusion chromatography (SEC). SEC profiles were obtained by WB (using an anti-myc antibody). (C,D) SEC profiles of TAp63α (10–614) ΔSAM (C; pink) and TAp63α (10–614) R(DBD; sfGFP) (D; green) compared with wild type (TAp63α(10–614), grey). R(DBD; sfGFP) indicates the replacement of the DBD by sfGFP. (E) Secondary structure prediction and mapping of structural motifs that stabilize the dimeric TAp63α. Cylinders and arrows represent α-helices and β-strands, respectively. Mutations (color-coded and indicated by filled circles) were introduced into TAp63α(10–614) on different faces of predicted secondary structure elements. The TAD is subdivided into TA1 (residues 10–26), TA2A (33–41) and TA2B (46–61). The TA1 forms an α-helix and the F16/W20/L23 motif constitutes the single interaction motif of the TA1. See Figure 1—figure supplement 5 for a thorough mapping of the TA1. (F) The two faces of the β-stranded TA2B were mutated (residues i, i+2, i+4 to alanine). SEC profiles of I50A I52A M54A (orange) and K49A E51A S53A (blue). See Figure 1—figure supplement 6 for a thorough mapping of the TA2. SEC of I50A I52A M54A was performed in technical triplicates and error bars denote standard deviation. (G) Transcriptional activities of TAp63α TD mutants on the p21 promoter in SAOS2 cells. Triple and double alanine mutations were introduced on the central hydrophobic interface of the TD. Bar diagrams show n-fold induction relative to the activity of the empty vector. Experiments were performed in biological triplicates and error bars denote standard deviation. (H) Mutations were introduced on the two faces of the TID β-strand. SEC profile of R598A I600A (red), E597A V599A D601A (blue), V603A F605 L607A (green) and R604A R608A (purple), Q609A I611A F613A (green) and R604A R608A (purple). See Figure 1—figure supplement 7 for SEC profiles of other mutants. (I) Central hydrophobic interface of the dimeric TD, showing the important I378 L382 M385 motif. (J) Transactivation assay of TAp63α(10–614) mutants that appeared tetrameric in previous experiments (see F, H and Figure 1—figure supplement 7). Transcriptional activities on the p21 promoter in SAOS2 cells were normalized to the protein level (determined by WB and referenced on GAPDH level). Experiments were performed in biological triplicates and error bars denote standard deviation.

DOI: http://dx.doi.org/10.7554/eLife.13909.003

Figure 1.

Figure 1—figure supplement 1. Domains behave as pearls on a string in tetrameric p63.

Figure 1—figure supplement 1.

[15N, 1H]-TROSY spectra of 15N-labeled DBD-TD-SAM and individual domains at 303 K. The construct ranging from DBD to SAM is used to investigate the behavior of tetrameric p63 proteins, specifically referring to ΔNp63α and activated TAp63α. Despite its high molecular weight of 200 kDa a well-resolved spectrum of 15N-labeled DBD-TD-SAM was obtained. The spectra of DBD and SAM overlay well with the spectrum of DBD-TD-SAM. The spectrum of the TD can be recognized with lower confidence, likely owing to unfavorable relaxation properties in the center of the protein. The ability to obtain such a spectrum already proofs that the domains do not form a globular structure but that they tumble independent of each other in solution. Titrations of the individual domains (DBD, TD and SAM) to each other also did not show any interaction (data not shown).
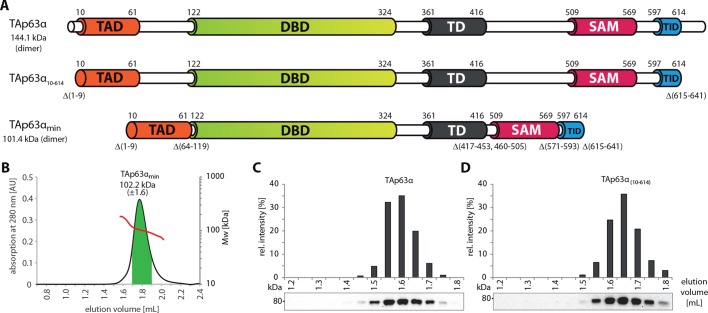
Figure 1—figure supplement 2. SEC-MALS proves the dimeric nature of TAp63αmin.

Figure 1—figure supplement 2.

(A) Domain organization of TAp63α: transactivation domain (TAD), DNA binding domain (DBD), tetramerization domain (TD), sterile alpha motif (SAM), transactivation inhibitory domain (TID). TAp63α(10–614) lacks the first 9 and the last 27 amino acids. In addition to these N- and C-terminal truncations the minimal construct of TAp63α (TAp63αmin) lacks linker regions between TAD and DBD (64–119), TD and SAM (417–453; 460–505) and SAM and TID (571–593). Residues 454–459 were used as a linker between TD and SAM. Identical to Figure 1A. (B) SEC-MALS of TAp63αmin. Change of molecular weight (Mw) is shown in red. Marked area in green was used to calculate the Mw. (C, D) SEC profiles of RRL (rabbit reticulocyte lysate) expressed TAp63α and TAp63α(10–614), obtained by western blots (using an anti-myc antibody) of eluted fractions and subsequent signal integration, are shown.
Figure 1—figure supplement 3. Deletion of 322–342 does not disrupt the dimeric state.

Figure 1—figure supplement 3.

SEC profiles of RRL expressed TAp63α(10–614) constructs Δ(K322-N342) and Δ(K322-N352).
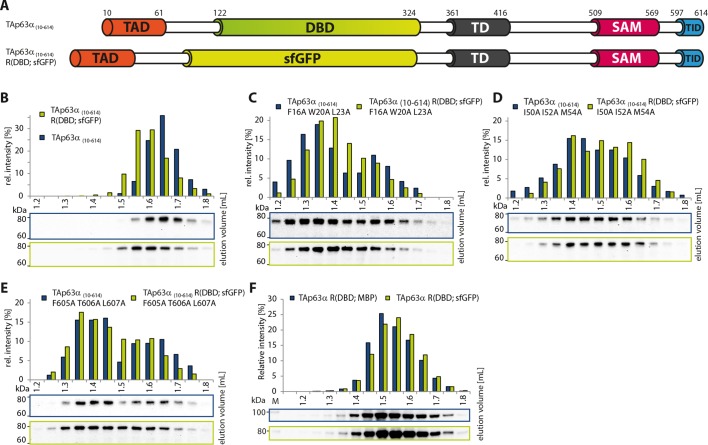
Figure 1—figure supplement 4. DBD is not essential to retain the dimeric state.

Figure 1—figure supplement 4.

(A) Constructs were designed based on TAp63α(10–614). R(DBD; sfGFP) indicates the replacement of the DBD by sfGFP. All constructs were expressed in rabbit reticulocyte lysate (RRL) and subjected to size exclusion chromatography (SEC) on a Superose 6 3.2/300 column. SEC profiles were obtained by western blots (using an anti-myc antibody) of eluted fractions and subsequent signal integration. (B) SEC profile of TAp63α (10–614) R(DBD; sfGFP) (green) and wild type (TAp63α (10–614), grey). R(DBD; sfGFP) indicates the replacement of the DBD by sfGFP. Identical to Figure 1D. (C) SEC profile of TAp63α (10–614) R(DBD; sfGFP) F16A W20A L23A (green) and TAp63α (10–614) F16A W20A L23A (grey). (D) SEC profile of TAp63α (10–614) R(DBD; sfGFP) I50A I52A M54A (green) and TAp63α (10–614) I50A I52A M54A (grey). (E) SEC profile of TAp63α (10–614) R(DBD; sfGFP) F605A T606A L607A (green) and TAp63α (10–614) F605A T606A L607A (grey). (F) SEC profiles of TAp63α R(DBD; sfGFP) (green) and TAp63α R(DBD; MBP) (dark blue).
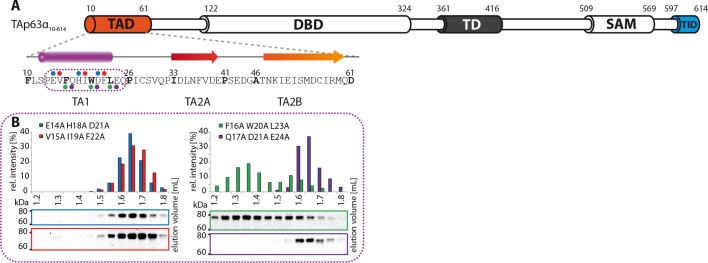
Figure 1—figure supplement 5. The TA1 forms an α-helix.

Figure 1—figure supplement 5.

(A) Secondary structure prediction and mapping of structural motifs in the TAD that stabilize the dimeric TAp63α. Cylinders and arrows represent α-helices and β-strands, respectively. Mutations (color-coded and indicated by filled circles) were introduced into TAp63α(10–614) on different faces of predicted secondary structure elements. The TAD is subdivided into TA1 (residues 10–26), TA2A (33–41) and TA2B (46–61). (B) The four faces of the α-helical TA1 were mutated (residues i, i+4, i+7 to alanine). SEC profiles of E14A H18A D21A (blue), V15A I19A F22A (red), F16A W20A L23A (green) and Q17A D21A E24A (purple). Only the F16A W20A L23A mutation disrupts the dimeric state. Therefore, the F16 W20 L23 motif constitutes the single interaction motif of the helical TA1.
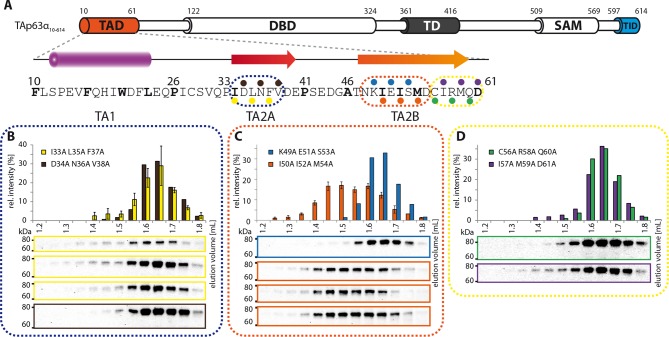
Figure 1—figure supplement 6. Mapping of structural motifs in the TA2.

Figure 1—figure supplement 6.

(A) Secondary structure prediction and mapping of structural motifs in the TAD that stabilize the dimeric TAp63α. Cylinders and arrows represent α-helices and β-strands, respectively. Mutations (color-coded and indicated by filled circles) were introduced into TAp63α(10–614) on different faces of predicted secondary structure elements. The TAD is subdivided into TA1 (residues 10–26), TA2A (33–41) and TA2B (46–61). (B) The two faces of the β-stranded TA2A were mutated (residues i, i+2, i+4 to alanine). SEC profiles of I33A L35A F37A (yellow) and D34A N36A V38A (brown). SEC of I33A L35A F37A was performed in technical triplicates and error bars denote standard deviation. (C,D) The two faces of the β-stranded TA2B were mutated (residues i, i+2, i+4 to alanine). (C) SEC profiles of K49A E51A S53A (blue) and I50A I52A M54A (orange). SEC of I50A I52A M54A was performed in technical triplicates and error bars denote standard deviation. Identical to Figure 1F. (D) SEC profiles of C56A R58A Q60A (green) and I57A M59A D61A (purple).
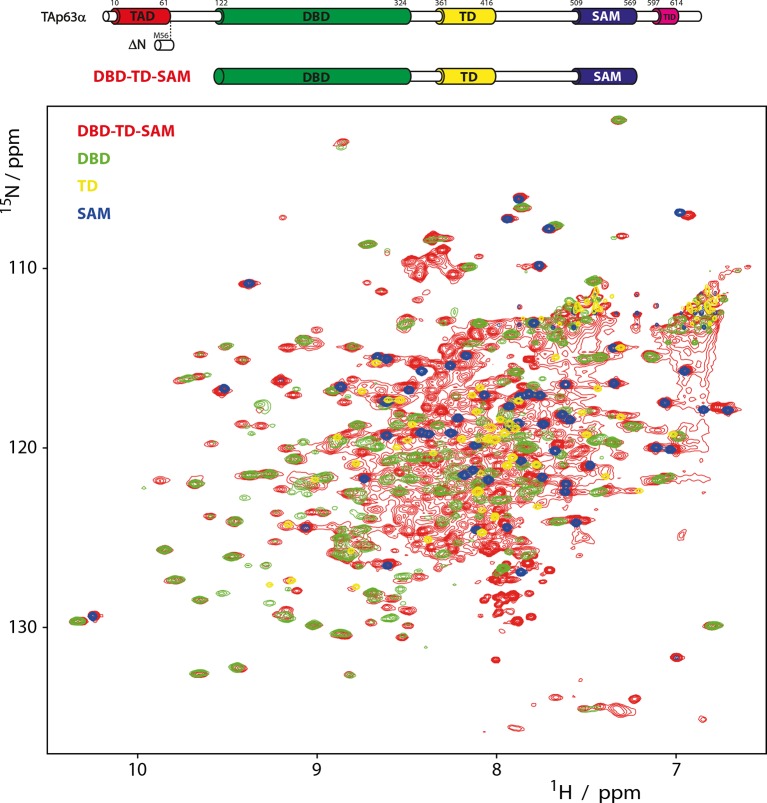
Figure 1—figure supplement 7. Mapping of structural motifs in the TID.

Figure 1—figure supplement 7.

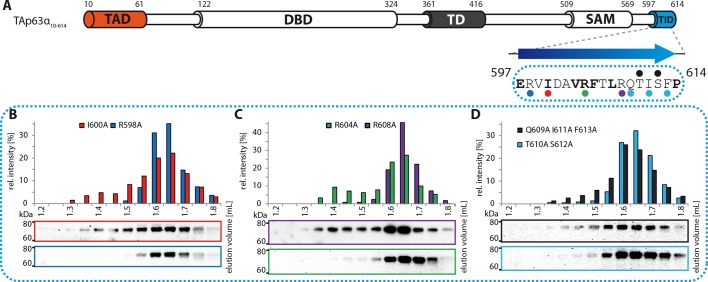
(A) Secondary structure prediction and mapping of structural motifs in the TID that stabilize the dimeric TAp63α. The TID is predicted to form a β-strand. Mutations (color-coded and indicated by filled circles) were introduced into TAp63α(10–614) on different faces of the β-strand. Mutations were performed to evaluate the contribution of the single amino acid mutants to the effect shown for the double mutations R598A I600A and R604A R608A (Figure 1H). In addition, the C-terminal part of the TID is mapped. (B) SEC profile of I600A (red) and R598A (blue). (C) SEC profile of R604A (green) and R608A (purple). (D) SEC profile of Q609A I611A F613A (black) and T610A S612A (cyan).
Figure 1—figure supplement 8. Mapping of structural motifs in the TD by measurement of transcriptional activities.

Figure 1—figure supplement 8.

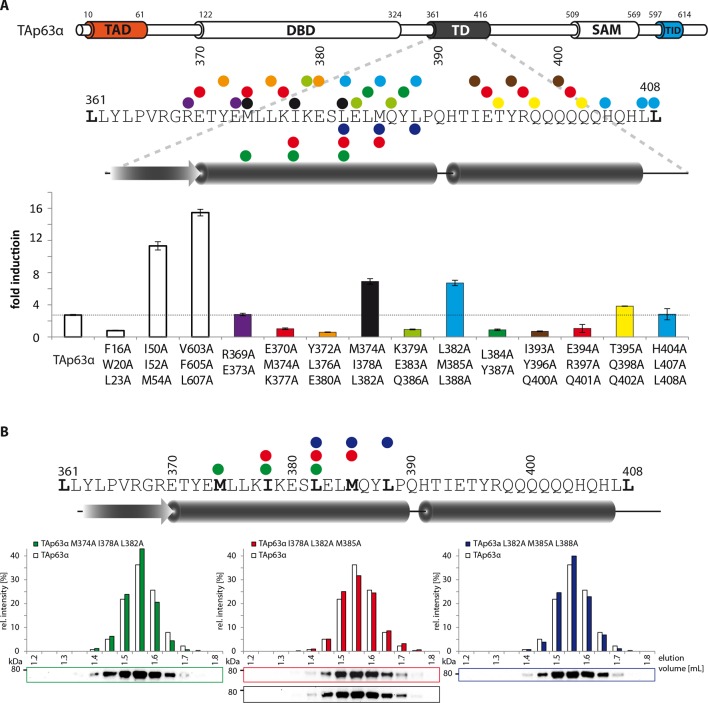
(A) Transcriptional activities of TAp63α TD mutants on the p21 promoter in SAOS2 cells. Triple and double alanine mutations were introduced on the surface of the two helices. Experiments were performed in triplicates. Bar diagrams show n-fold p21 promoter induction relative to the activity of the empty vector control. Mutations M374A I378A L382A and L382A M385A L388A suggest that the hydrophobic interface starting from the center to the end of the first α-helix is important for the stabilization of dimeric TAp63α. Further detailed experiments are shown in Figure 1G. (B) SEC profiles of TAp63α mutants M374A I378A L382A (green) I378A L382A M385A (red) and L382A M385A L388A (blue) are identical to wild type TAp63α although they are transcriptionally active and should therefore exhibit a more open conformation. Since the tetrameric interface is mutated, the mutants cannot form tetramer but only dimers.
Figure 1—figure supplement 9. Validation of structural motifs by pull-down with GST-TID.

Figure 1—figure supplement 9.

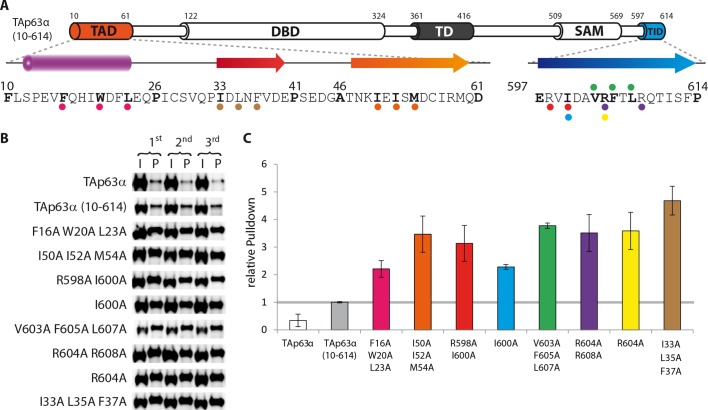
(A) Secondary structure prediction and mapping of structural motifs that stabilize the dimeric TAp63α. Cylinders and arrows represent α-helices and β-strands, respectively. Mutations (color-coded and indicated by filled circles) were introduced into TAp63α (10–614) on different faces of predicted secondary structure elements. Transcriptional activities of identical mutations were investigated in a separated experiment (see Figure 1J). (B,C) Western blot (B) and corresponding bar diagram (C) of pull-down experiments (using immobilized TID) with TAp63α (10–614) mutants that appeared tetrameric in previous experiments and the I33 L35A F37A mutant. (B) Western blots used for quantification of pull-down with GST-TID. Experiments were performed in technical triplicates. (C) Quotient of pull-down (P) and input (I) is shown relative to TAp63α (10–614) (set to 1). Error bars denote standard deviation. All mutants showed a more than 2-fold pull-down compared to TAp63α (10–614) which indicates that they exist in an open conformation, exposing hydrophobic patches. Surprisingly the I33A L35A F37A mutant exhibited the highest pull-down, indicating that I33, L35, and F37 do indeed play a structural role inside TAp63α, likely in forming a beta-strand as predicted. Error bars denote standard deviation.
Figure 1—figure supplement 10. Transcriptional activities of tetrameric TAp63γ mutants.

Figure 1—figure supplement 10.

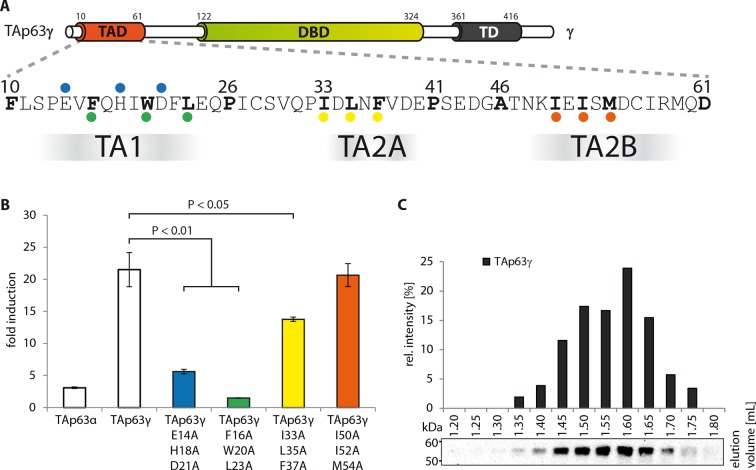
(A) Motifs in the TAD of TAp63γ are tested for their importance in transcriptional activation. (B) Transcriptional activities of human TAp63γ mutants on the p21 promoter in SAOS2 cells. Bar diagrams show n-fold p21 promoter induction relative to the activity of the empty vector control. Experiments were performed in biological triplicates and error bars denote standard deviation. Means were compared using Student’s t-test. (C) TAp63γ forms tetramers (expected molecular weight: 204 kDa). TAp63γ was expressed in rabbit reticulocyte lysate (RRL) and subjected to size exclusion chromatography (SEC) on a Superose 6 3.2/300 column. SEC profile of TAp63γ was obtained by western blot (using an anti-myc antibody) of eluted fractions and subsequent signal integration.