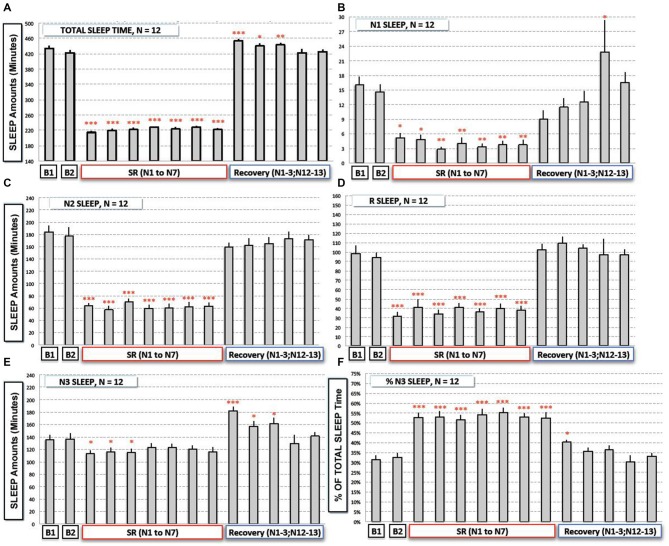
Figure 2.
Total and sleep stages (N1, N2, N3 and REM Sleep) durations during baseline (B1, B2), the sleep restriction (SRN1 to SRN7) and the following sleep recovery period (RN1–RN3, RN12 and RN13). (A) Total sleep time, (B) N1 sleep, (C,D) N2 and REM sleep, (E,F) N3 sleep and proportion of N3 sleep (% of total sleep time) are represented (gray bars) as mean of amounts in min (or % for F; ± SEM) for the 12 subjects. Significant differences compared to baseline values (B2): *p < 0.05; **p < 0.01; ***p < 0.001.

