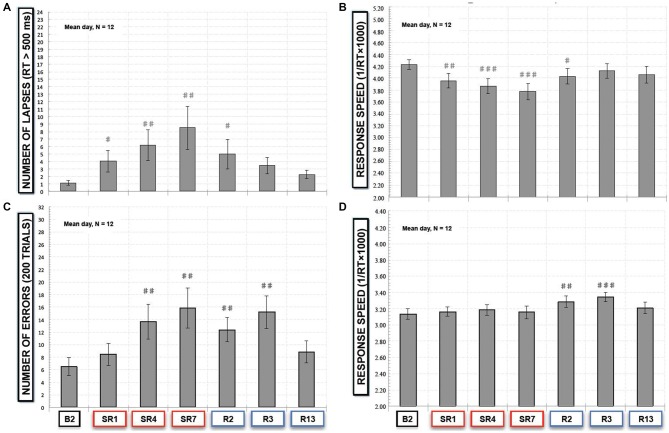
Figure 3.
(A) Number of lapses responses (RT > 500 ms) and (B) response speed in the simple reaction time task (SRTT) task and (C) number of errors (“NoGo responses”) and (D) response speed of “Go” trials in the Go-NoGo task. All these variables are represented as the mean (± SEM) of the 12 subjects that performed at baseline (B2), during the sleep restriction period (SR1, SR4 and SR7), and the following period of sleep recovery (R2, R3 and R13). Significant differences compared to baseline values (B2): #p < 0.05; ##p < 0.01; ###p < 0.001.

