Figure 2.
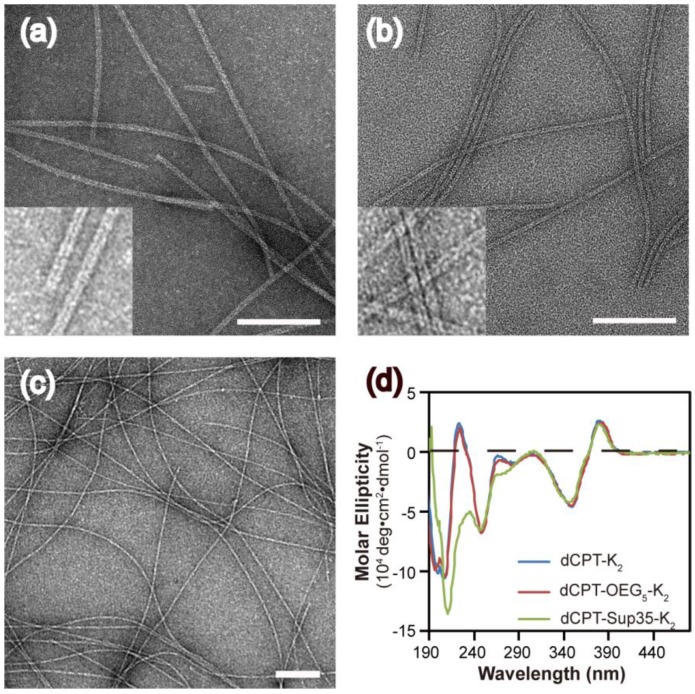
Molecular assembly and characterization of designed SAPDs. Representative TEM images of nanotubes formed by dCPT-K2 with diameter of 8.2 ± 0.8 nm (a) and dCPT-OEG5-K2 with diameter of 7.5 ± 0.7 nm (b). (Insert) High resolution TEM images display the tubular morphology. (c) TEM image of nanofibers formed by dCPT-Sup35-K2 with diameter of 6.9 ± 1.4 nm. (d) Normalized CD spectra of the three studied supramolecular prodrugs in water. All the samples were prepared at concentration of 100 μM in water and aged over three days before measurements. TEM samples were negatively stained with 2 wt% uranyl acetate and all scale bars = 100 nm. More TEM images can be found in the SI (Figure S4-S6).

