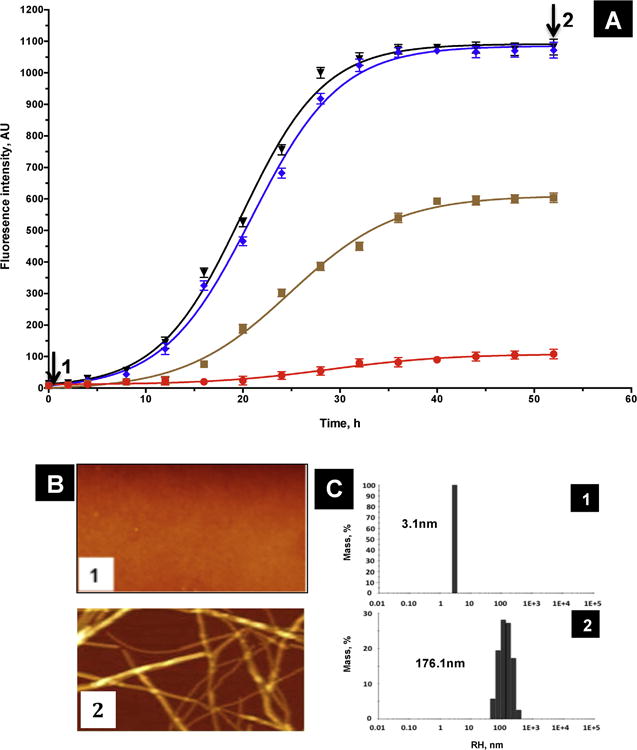
Figure 3. Aggregation of α-syn.

A) Time course of aggregation monitored by ThT fluorescence (10 μM, red; 35 μM, orange; 70 μM, blue and 100 μM, black). The time-dependence of ThT fluorescence was fitted to a sigmoidal growth model as described under « Materials and methods ». ThT fluorescence results are the means of three independent experiments. B) AFM images of 70 μM α-syn at 0 h (sample 1), and 52h (sample 2). C) DLS histograms of 70 μM α-syn at 0 h (sample 1) and 52h (sample 2).
