
Figure 5. The inhibition of α-syn aggregation by structural domains of Hsc70.
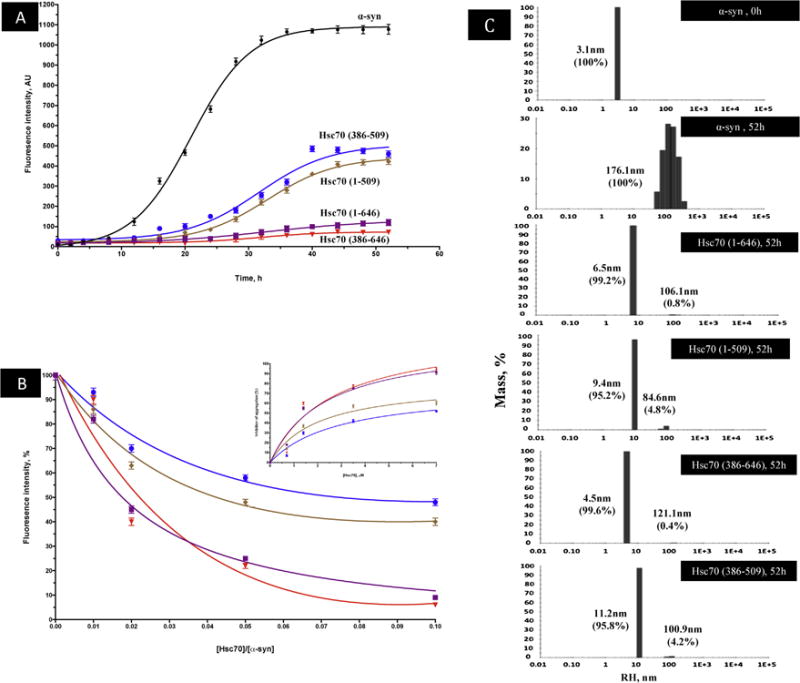
A) The time dependence of amyloid inhibition by Hsc70 and its structural domains. B) Extent of inhibition (%) of α-syn aggregation by Hsc70 and its structural domains (% calculated with respect to the ThT fluorescence of α-syn at 52h) at increasing ratios of [Hsc70]/[α-syn]. Inset: Percentage of Inhibition of α-syn aggregation at a constant α-syn concentration (70 μM) and increasing concentrations of Hsc70 and its respective structural domains at 52h of incubation. This inhibition was fitted using the hyperbolic equation Y = Bmax*X/(Kd + X). Where Bmax is the maximum specific binding in the same units as Y. It is the specific binding extrapolated to very high concentrations of [Hsc70], and so its value is almost always higher than any specific binding measured in the experiment. Kd is the equilibrium binding constant, in the same units as X. It is the chaperone concentration needed to achieve a half-maximum binding at equilibrium.
ThT fluorescence results are the means of three independent experiments. C) DLS analysis of α-syn in presence and absence of Hsc70 and its structural domains. The histograms represent the mass percentage of aggregates species.