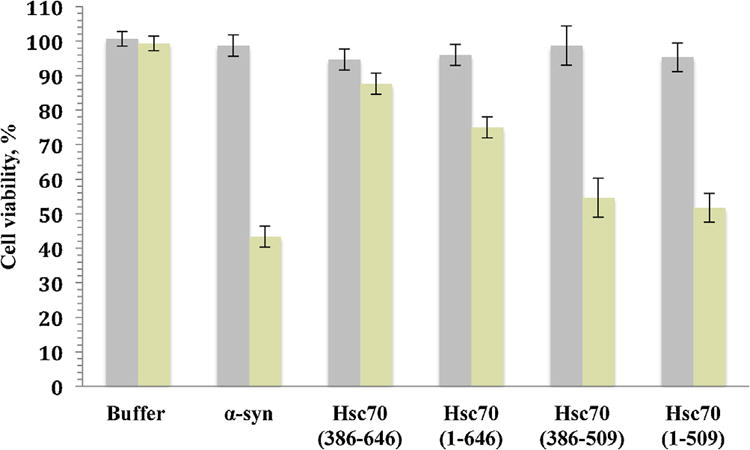
Figure 6. Cell viability assays.

Viability of SHSY5Y neuronal cells upon exposure to soluble α-syn at 0h (grey histogram) or α-syn aggregates in the absence and presence of Hsc70 and its domains sampled at 52h (yellow histogram). The final protein concentration within the culture medium was 1 μM. The cells were incubated in the absence and presence of Hsc70 chaperone and its structural domains for 24 h. Cell viability is expressed as the percentage of 3-(4,5-dimethylthiazol-2-yl)-2,5-diphenyltetrazolium bromide (MTT) reduction using cells treated with the same volume of buffer as a reference (100% 3-(4,5-dimethylthiazol-2-yl)-2,5-diphenyltetrazolium bromide reduction). The values (averages ± S.D.) are obtained from three independent experiments.
