6.
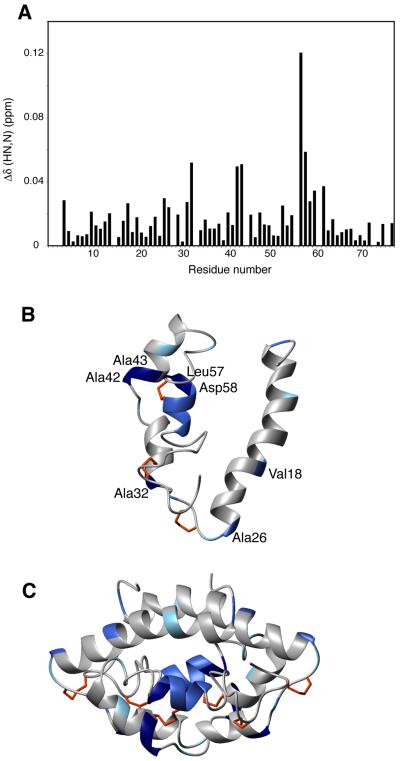
Evidence for lipid binding by CBP. (A) Chemical shift perturbation of CBP after delipidation procedure monitored by HSQC spectra. Ribbon diagram of CBP monomer (B) and dimer (C) colored according to chemical shift changes induced following presumed delipidation of CBP. Residues colored by gradient, with most affected residues colored with darkest blue to those unaffected in white. The residues most affected are also labeled in (B).

