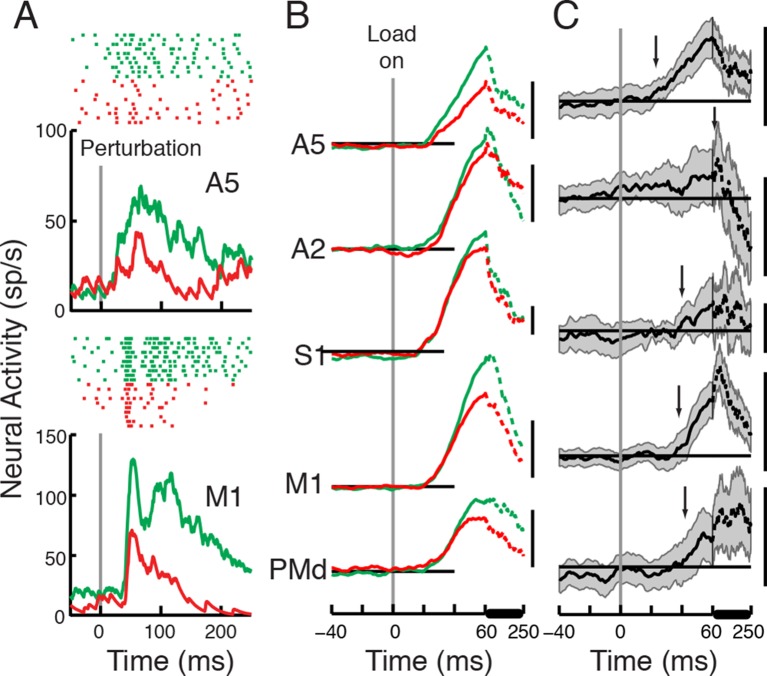
Figure 3. Perturbation responses compared across the Posture and Movie Tasks.
(A) Perturbation response across the Posture (green) and Movie (red) tasks (same neurons as in Figure 1D). (B) Population signal and (C) differential signal across tasks (Posture - Movie) in each cortical area. Each scale bar represents 20 sp/s.

