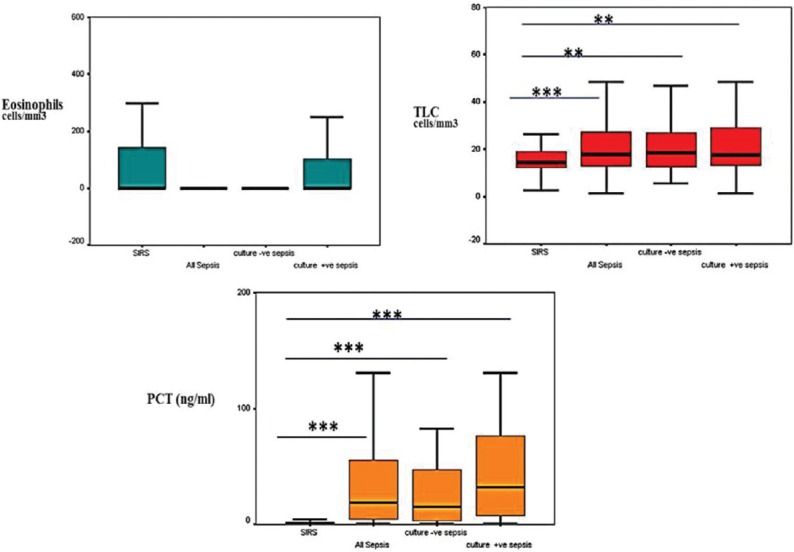
Figure 1.

Box plot presentation of absolute eosinophil count, total leucocyte count and procalcitonin levels in different study groups, central line represent median, boxes represent 25th–75th percentiles; whiskers, 95% confidence interval. Noninfectious systemic inflammatory response syndrome group was compared with all sepsis, culture negative and culture positive sepsis groups, *P < 0.05, **P < 0.01, ***P < 0.001
