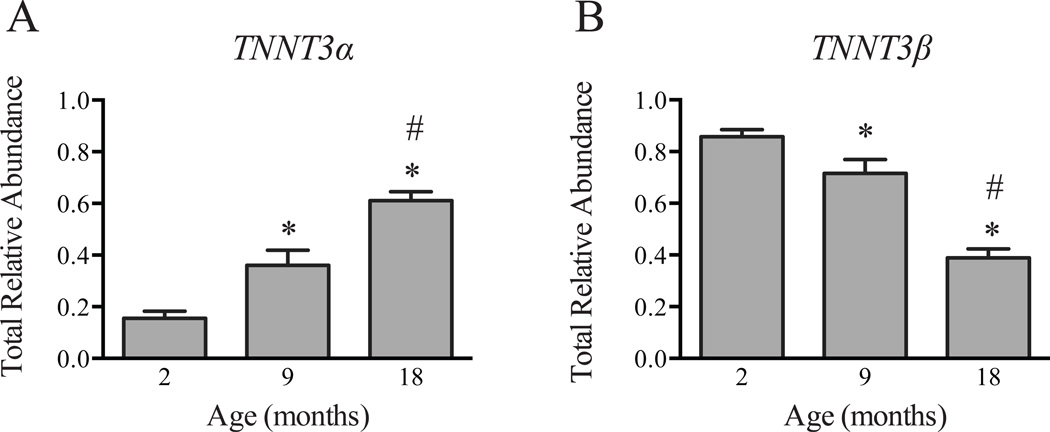
Figure 1. Effect of age on TNNT3 alternative splicing patterns.
The relative abundance of the 12 TNNT3 splice forms in gastrocnemius muscle of 2-, 9-, and 18-month old rats was assessed by a combination of PCR analysis and capillary electrophoresis as described under “Methods”. The total relative abundance of (A) TNNT3α and (B) TNNT3β splice forms is shown. Statistical significance (p<0.05) was determined by one-way ANOVA and Tukey’s post-hoc test. n=6–7 per group. * compared to 2-month old rats; # compared to 9-month old rats.

