
Figure 3.
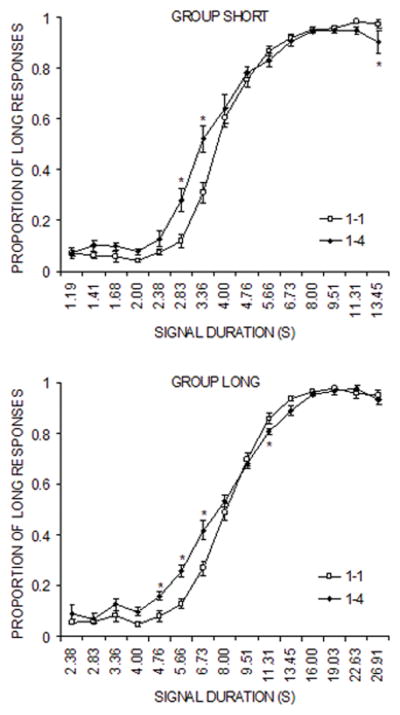
Psychophysical functions plotting proportion of ‘long’ responses against test duration during the baseline (1-1) and reward magnitude manipulation (1-4) phases for groups Short (top panel) and Long (bottom panel) in Experiment 3.
Official websites use .gov
A
.gov website belongs to an official
government organization in the United States.
Secure .gov websites use HTTPS
A lock (
) or https:// means you've safely
connected to the .gov website. Share sensitive
information only on official, secure websites.
Psychophysical functions plotting proportion of ‘long’ responses against test duration during the baseline (1-1) and reward magnitude manipulation (1-4) phases for groups Short (top panel) and Long (bottom panel) in Experiment 3.