. Author manuscript; available in PMC: 2016 Aug 1.
Published in final edited form as: J Magn Reson Imaging. 2014 Dec 4;42(2):269–279. doi: 10.1002/jmri.24802

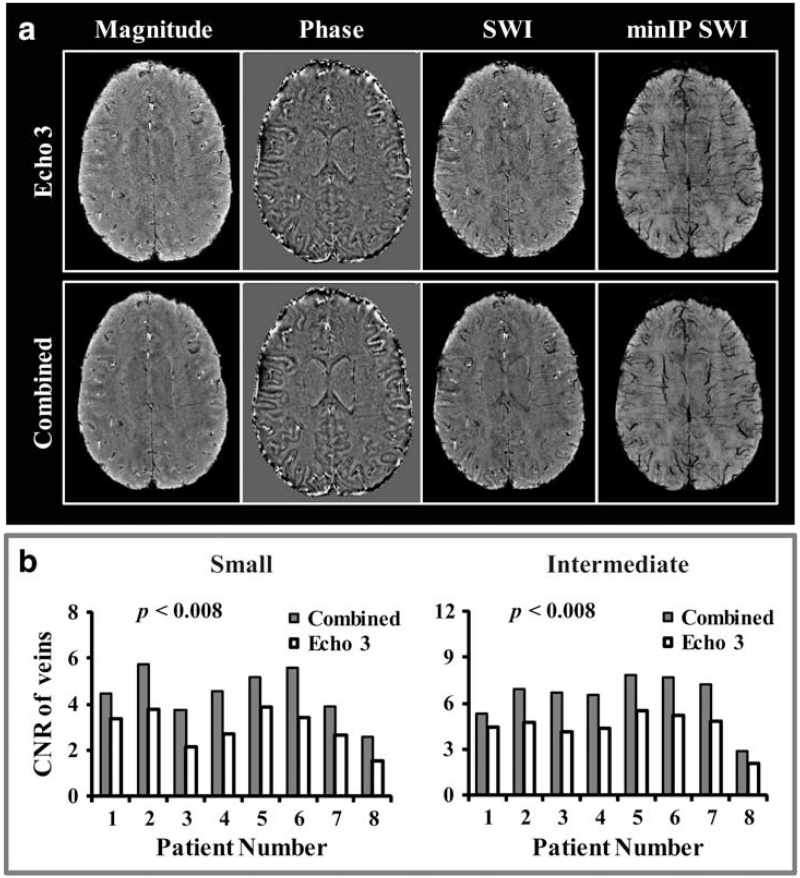
FIGURE 4. A: Magnitude, phase, SWI, and minIP images from echo 3 (top row) and combined processing (bottom row), where both magnitude and phase images from echoes 2 to 4 were first created individually and then averaged to generate mean magnitude and phase images before generating the final SWI images. The SNR was greatly improved for the combined composite SWI image compared with that from the echo 3 (whose TE was similar to that of single-echo SWI sequence), which is evident by a more homogeneous display of the ventricles on the former. B: Plots of average CNR for both small and intermediate veins from minIP SWI images of echo 3 and the composite SWI image for all 8 patients. The composite SWI image had significantly higher CNR for both vein sizes in all patients.

FIGURE 4