Figure 1.
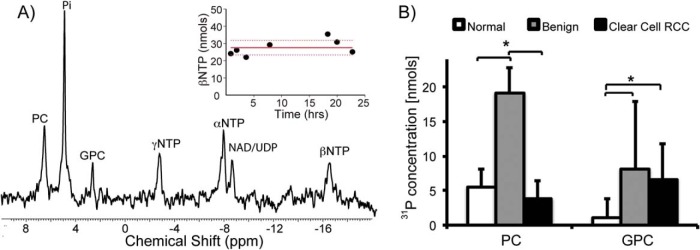
Bioenergetics of renal tissue slices. 31P spectrum of tissue slices (∼80 mg) from a grade 2 ccRCC tissue (A). The inset shows the maintenance of tissue viability with unchanged βNTP concentration of tissue slices continuously perfused in the bioreactor for over 24 hours. Bar graph of the varying levels of phospholipids in renal tissue slices (n = 10 for normal renal parenchymal tissue, n = 10 for ccRCCs, and n = 3 for benign renal tumors) (B). PC concentration in the benign renal tumors is significantly higher than that in both the normal renal parenchyma (P = .019) and ccRCC (P = .008) tissues. In contrast, GPC was significantly higher in both benign renal tumors and ccRCCs compared with that in normal renal parenchyma tissue (P = .027 and .003, respectively). White bars indicate normal renal parenchymal tissue, gray bars indicate benign renal tumors, and black bars indicate ccRCCs, with standard deviation error bars.

