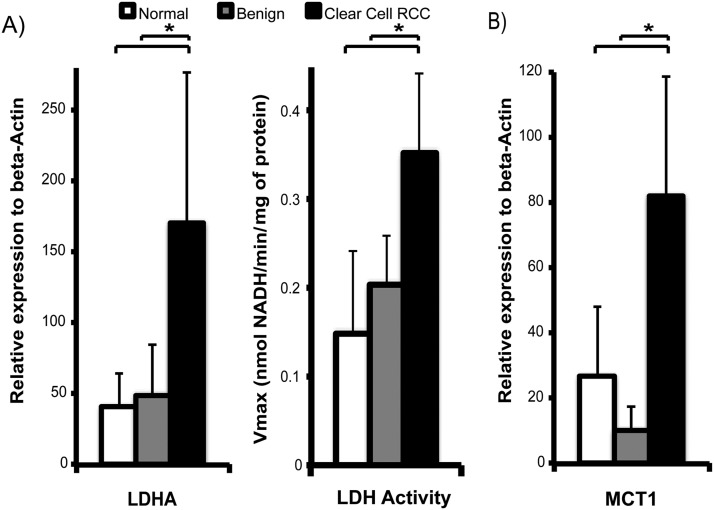
Figure 3.
LDHA expression and LDH activity and MCT1 expression in renal tissue slices. Mean LDHA mRNA expression is higher in ccRCCs than in either normal renal tissues or benign tumors (P = .001 and .016, respectively), and the LDH activity was also correspondingly higher in ccRCC than in either normal renal tissues (P = .020) or benign tumors (P = .030) (A). MCT1 expression is significantly higher in ccRCCs than in both normal renal tissues (P = .006) and benign tumors (P = .002) (B). The sample size of the tissues used for mRNA analyses is as follows: n = 11 for normal renal tissue, n = 3 for benign renal tumors, and n = 7 for ccRCCs. White bars indicate normal renal tissue, gray bars indicate benign renal tumors, and black bars indicate ccRCC, with standard deviation error bars.

