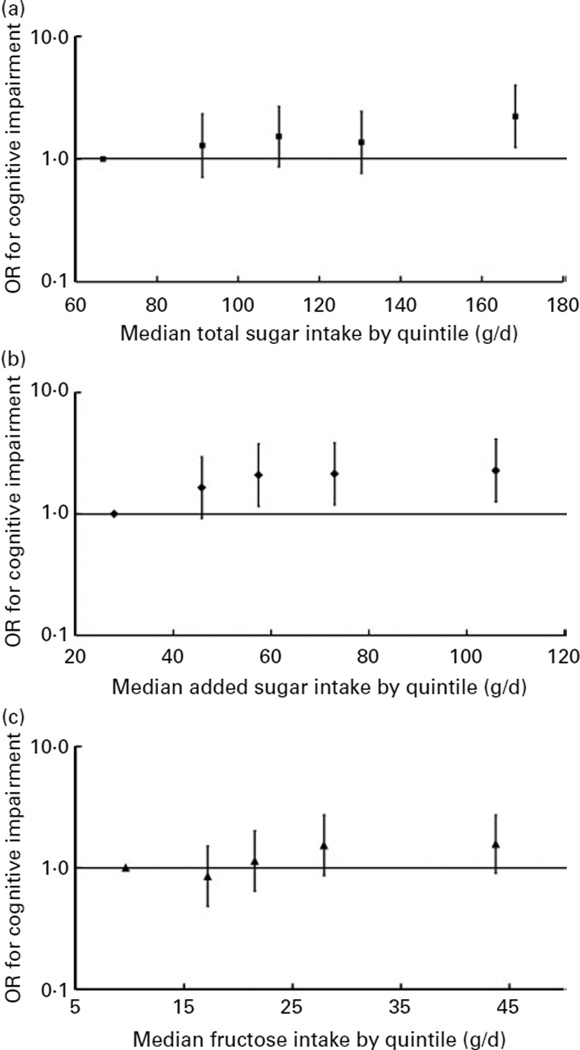
Fig. 1.
Multivariate-adjusted OR and 95% CI for cognitive impairment according to quintile of energy-adjusted total sugar (P for trend=0·015) (a), added sugar intakes (P for trend=0·040) (b) and fructose intake (natural plus added) (P for trend=0·072) (c) among participants without diabetes from the Boston Puerto Rican Health Study, 2004–9. OR and 95% CI were plotted against the median of sugar intake of each quintile. The median (range) of total sugar intake (g/d) across quintiles of total sugar intake were: 66·7 (<820), 91·2 (82·0–100·8), 110·0 (100·9–118·3), 130·4 (118·4–145·5) and 168·3 (> 145·5), respectively. The median (range) of added sugar intake (g/d) across quintiles of added sugar intake were: 27·9 (<37·9), 45·8 (38·0–51·0), 57·4 (51·1–64·6), 73·0 (64·7–85·1) and 106·0 (>85·1), respectively. The median (range) of fructose intake (g/d) across quintiles of fructose intake were: 9·6 (<14·2), 17·2 (14·2–19·3), 21·5 (19·4–24·9), 27·9 (25·0–33·8) and 43·7 (>33·8), respectively. Cognitive impairment was defined as a Mini-Mental State Examination score <24. OR was calculated with logistic regression, after adjustment for age (years), sex, educational attainment (< 5th grade, 5th–8th grade, 9th–12th grade, college, or graduate school), poverty (yes or no), acculturation score, smoking (never, former, or current), alcohol use (never, former, or current), physical activity score, BMI (kg/m2; < 25, 25–29·9, or ≥ 30), and the presence of hypertension.

