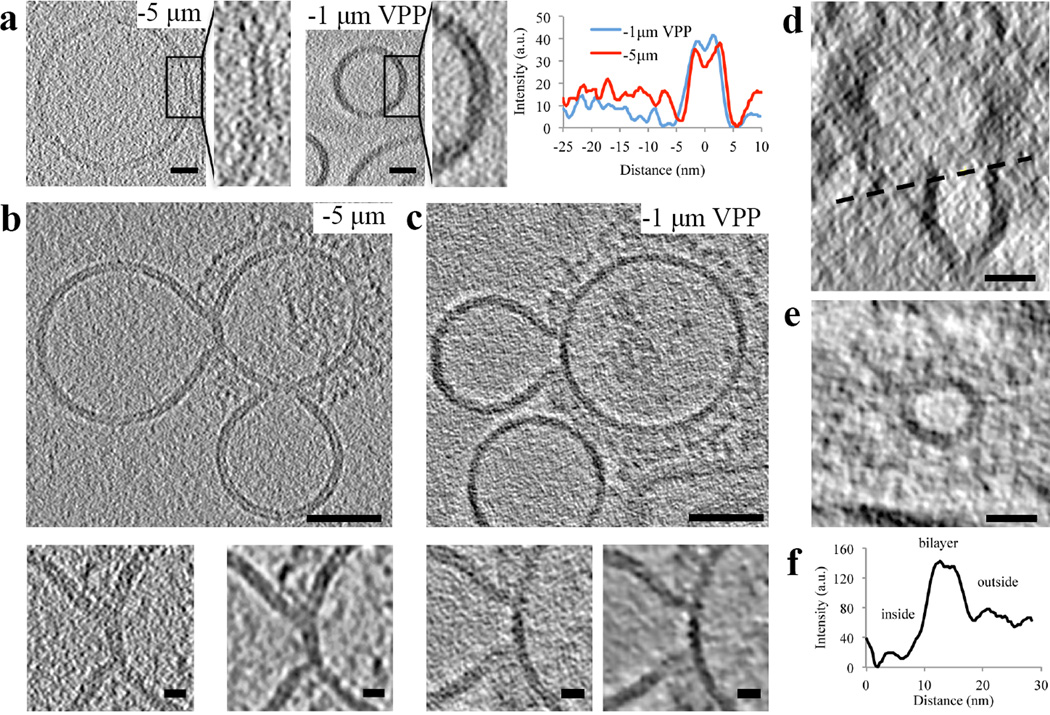
Figure 2. Defocus-phase contrast cET and VPP-cET of liposomal membrane, “Y” shaped lipidic junctions and hemifusion diaphragms.
a, Tomogram slices (0.74 nm thick), calculated by the weighted-back projection method, from a tilt series acquired with an electron dose 80 e−/Å2 either at defocus −5 µm without VPP or at defocus −1 µm with VPP showing liposomal membrane. The radially averaged density profile plots are shown on the right. Scale bars: 10 nm. b and c, G1S VLP when mixed with liposomes containing 16 mol % cholesterol and incubated for 20 minutes at neutral pH and subsequently subjected to pH 5 at 37°C for approximately 2 minutes show junctions and hemifusion. b, Tomogram slice (3 nm thick) acquired at defocus −5 µm capturing two “Y” shaped junctions of the hemifusion diaphragm (HD). Magnified HD regions below before (left) and after (right) nonlinear anisotropic diffusion (NAD, k=50, 10 iterations) are shown below. The bilayer thickness, ~6 nm at the “Y” shaped lipidic junction, did not increase when compared with liposome or VLP. c, Tomogram slices (3 nm thick) acquired at defocus −1 µm with Volta phase plate (VPP) capturing “Y” shaped junctions of the hemifusion diaphragm (HD). Magnified HD regions below before (left) and after (right) nonlinear anisotropic diffusion (NAD, k=10, 10 iterations) are shown below. d, Transverse (X-Z) tomogram slice of a filamentous VLP and the hemifused liposome forming a complete HD. e, Tomogram slice (3 nm thick) of the circular junction connecting the liposome and the filamentous VLP indicated by the black dashed line shown in d. e, The radially averaged density profile plot of the circular junction shown in e (zero on the x-axis marks the center of the hemifusion diaphragm interior). Scale bars: 50 nm (b and c), 20 nm (d and e), 10 nm (Magnified views). The tomographic slices are representative of 40 and 16 VLP-liposome interactions found in 12 and 10 tomograms collected with and without VPP on 2 independent grids of two independent samples, respectively.

