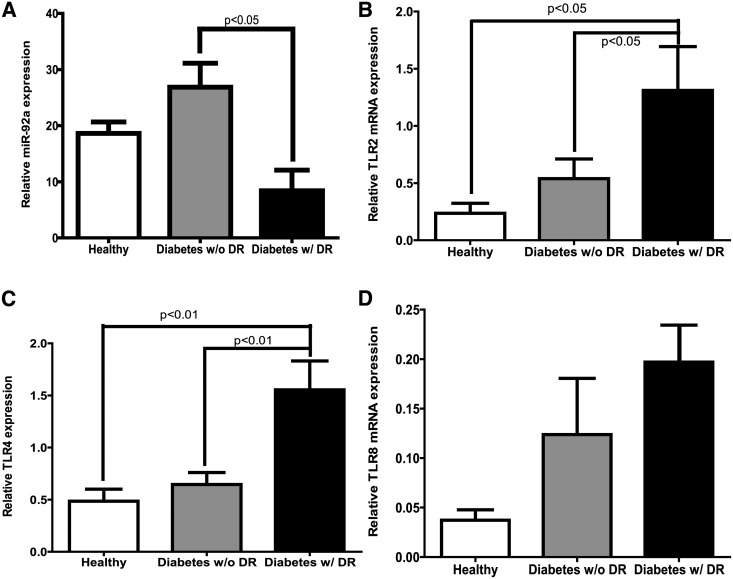
Figure 7.
Patients with diabetes protected from DR show an upregulation in miR-92a and a decrease in TLR expression. A: Bar chart showing increase in miR-92a expression in Diabetes w/o DR compared with Diabetes w/DR. mRNA expression determined using real-time quantitative PCR showing decrease in expression of TLR2 (B), TLR4 (C), and TLR8 (D) in the Diabetes w/o DR group. n = 5, Diabetes w/o DR; n = 3, Diabetes w/DR; n = 5, control subjects without diabetes.

