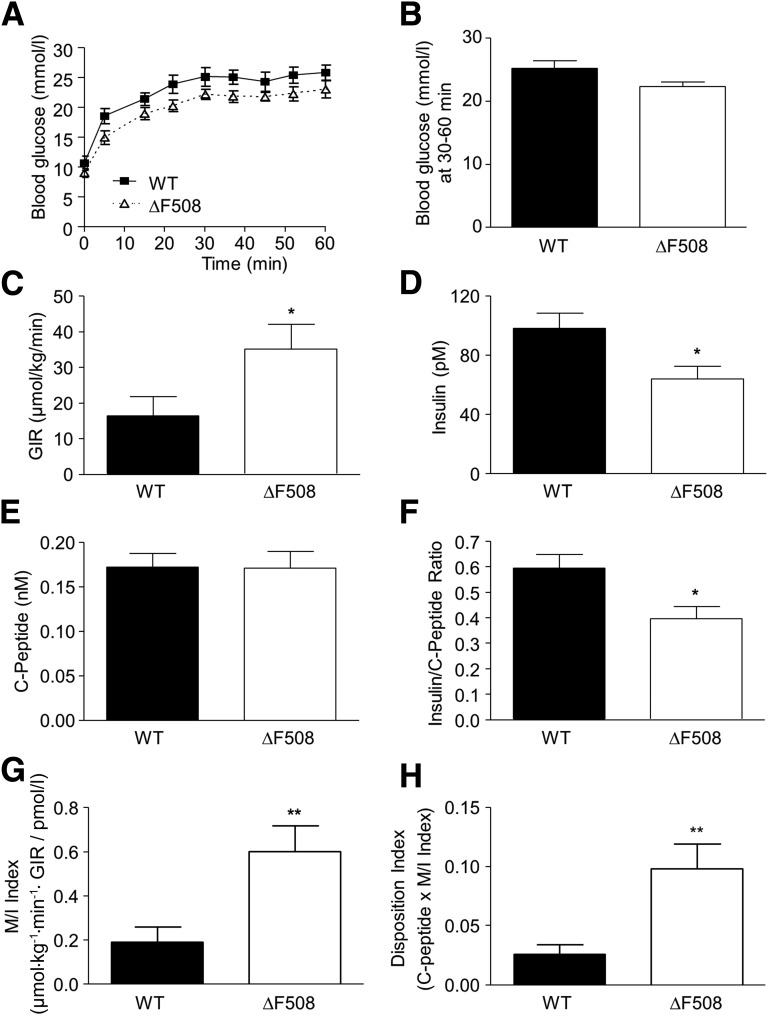
Figure 4.
Insulin secretion and sensitivity in vivo in 12-week-old male ΔF508 mutant mice. Hyperglycemic clamps were performed in 12-week-old male WT and ΔF508 mice. A: Blood glucose levels during the glucose clamp. B: Average blood glucose levels during the steady-state between 30 and 60 min. C: GIR. D: Plasma insulin levels. E: Plasma C-peptide levels. F: Insulin–to–C-peptide ratio. G: M/I. H: DI. Data are mean ± SEM of 10 mice per group. *P < 0.05, **P < 0.01 vs. WT.

