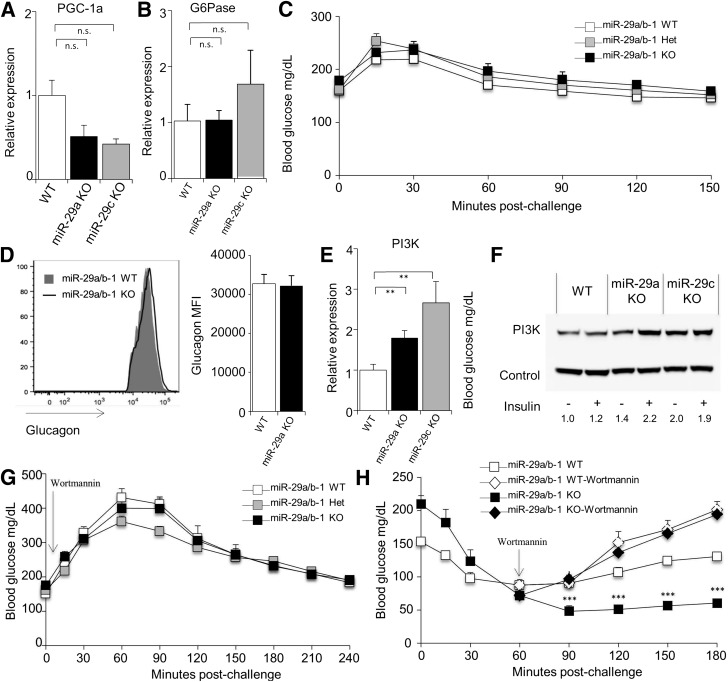
Figure 3.
The miR-29 family regulates hepatic PI3K expression. cDNA was produced from the liver of wild-type, miR-29a−/−, and miR-29c−/− mice, and quantitative PCR was performed for PGC-1a (A) and G6Pase (B), relative to Rpl37a (n = 9, 7, and 3, respectively). C: Blood glucose levels of wild-type, miR-29a+/−, and miR-29a−/− mice after fasting and challenge with exogenous glucagon. D: Mean fluorescence intensity (MFI) of anti-glucagon antibody staining on islets purified from wild-type and miR-29a−/− mice (n = 5 and 4). E: cDNA was produced from the liver of wild-type, miR-29a−/−, and miR-29c−/− mice, and quantitative PCR was performed for PI3K, relative to Rpl37a (n = 9, 7, and 3). F: Protein lysate was produced from the liver of wild-type, miR-29a−/−, and miR-29c−/− mice after fasting at 30 min after insulin injection, and Western blotting was performed for PI3K. G: Wild-type, miR-29a+/−, and miR-29a−/− mice were fasted for 6 h, injected with wortmannin, and challenged with exogenous insulin, prior to measurement of blood glucose levels (n = 4, 12, and 6). H: Wild-type and miR-29a−/− mice were fasted for 6 h and challenged with exogenous insulin prior to measurement of blood glucose levels (n = 28 and 24). At 60 min postinsulin treatment, wortmannin was given to a subset of individuals from each genotype (n = 4 and 6). Median ± SEM. **P < 0.01 and ***P < 0.001. KO, knockout; n.s., not significant; WT, wild-type.

