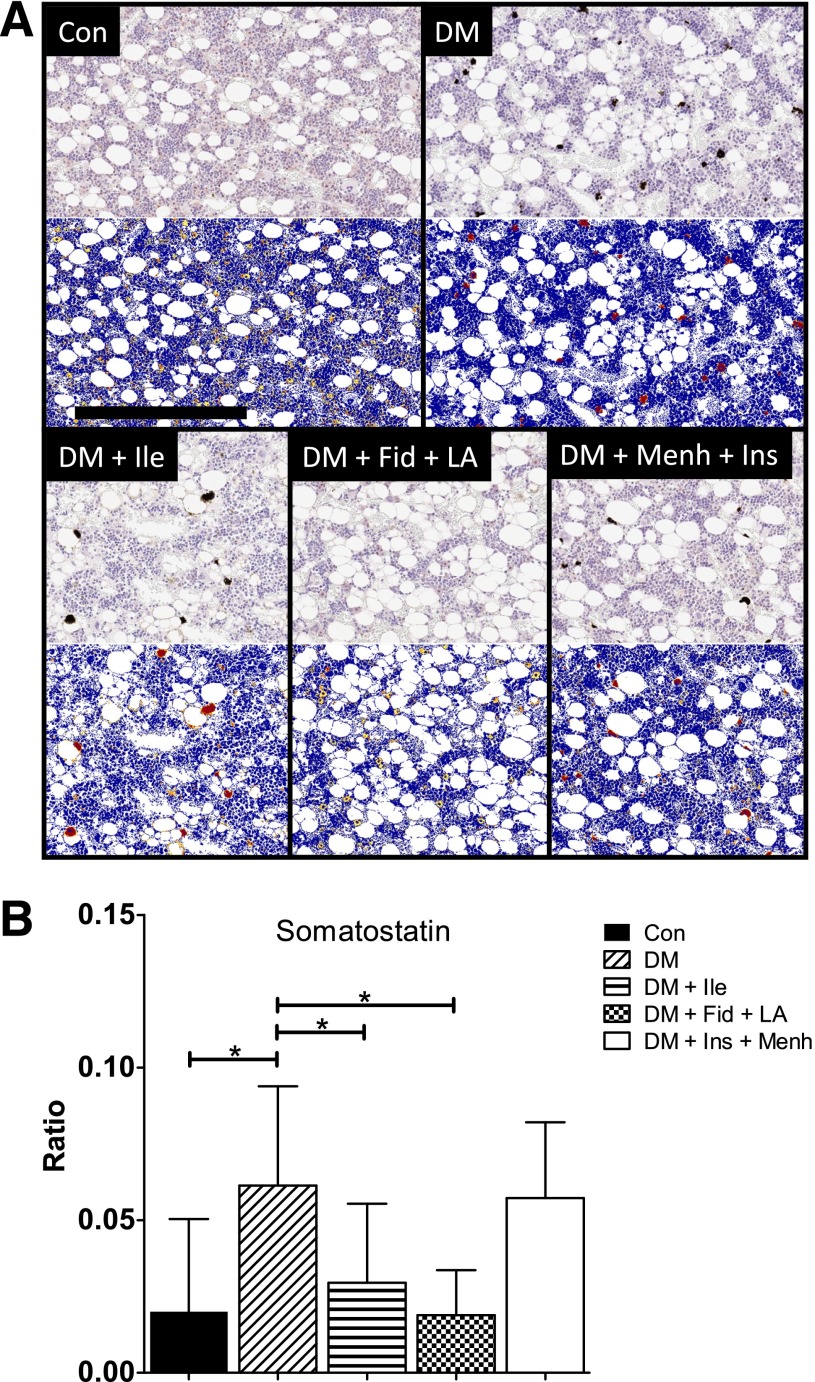
Figure 2.
A: SST staining of middle distal femoral marrow. Images show representative SST staining before (top gray images) and after quantification (bottom blue images) by Aperio using the Positive Pixel Count algorithm. In the markup images, a positive stain is indicated by yellow (weak positive), orange (middle positive), and red (strong positive). There were 7–12 animals per group. Scale bar = 300 µM. B: Ratio of strong-positive SST pixels to total positive pixels in the middle distal femur. Data represent mean ± SD. *Significant differences between groups (P < 0.05).

