
Fig. 4.
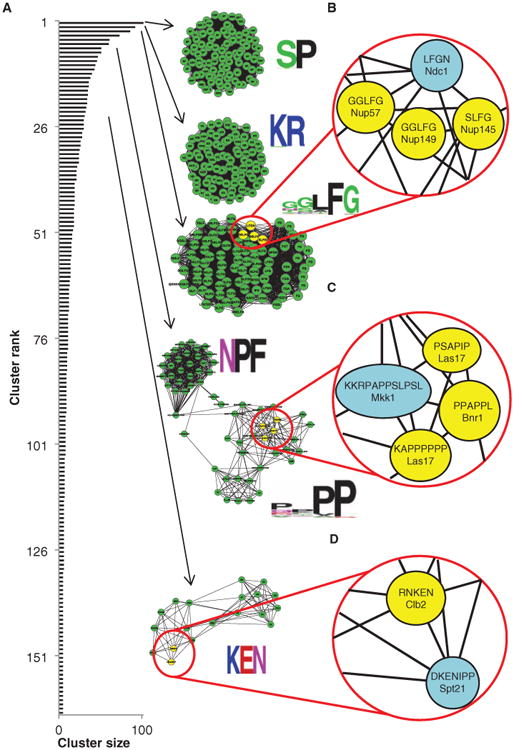
Known short linear motif patterns are recovered by cluster analysis. (A) Distribution of cluster sizes (black bars) and examples of highly interconnected motifs identified in the cluster analysis that represent known sequence patterns (green clusters). Beside each cluster is a graphical representation of the specificity of the motif. (B) A close-up representation of the FG motif cluster shows interconnection between known FG motifs in nuclear pore proteins (highlighted in yellow) and an uncharacterized FG motif in Ndc1 (highlighted in blue). (C) A close-up representation of the P-rich motif cluster shows interconnection between a putative SH3-binding peptide (in Mkk1, highlighted in blue) and known SH3-binding peptides (in Las17 and Bnr1, highlighted in yellow). (D) A close-up representation of the KEN motif cluster shows connection between the previously uncharacterized KEN motif in Spt21 (highlighted in blue) and an experimentally verified KEN motif in Clb2 (highlighted in yellow). See table S4 for a complete list of the proteins identified in each highlighted cluster.