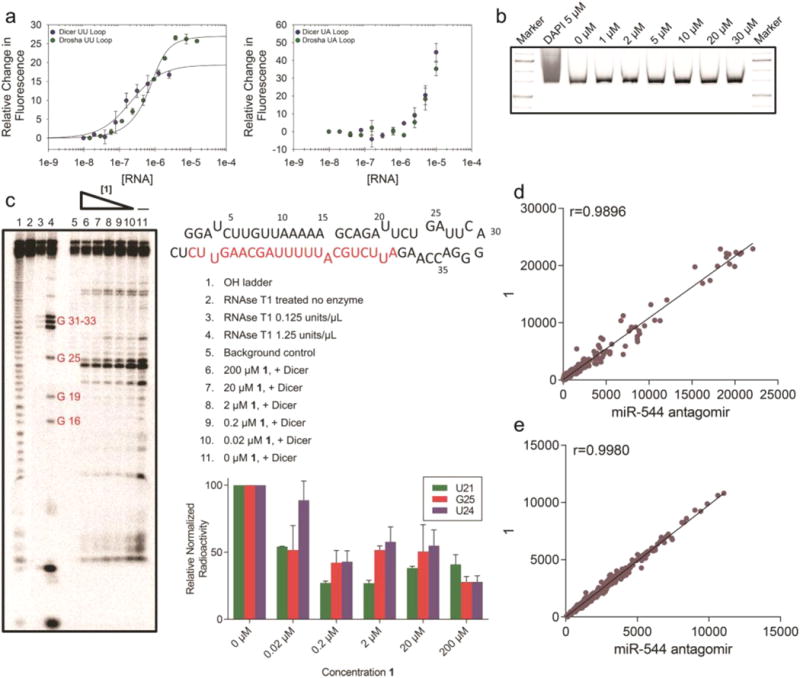
Figure 4.

Characterization and specificity of 1. (a) Representative binding curves for the binding of 1 to Drosha and Dicer processing sites of miR-544 with the internal loops present (left) or ablated (right). (b) 1 at the indicated molar concentrations was incubated with a ∼600 bp fragment of PCR amplified DNA for a period of 2 h. The fragment was then subjected to PAGE analysis followed by SYBR-Gold staining. Unlike DAPI incubated DNA, 1 did not elicit a shift in the DNA fragment even at high molar concentrations. (c) Radioactive end-labeled pre-miR-544 was cleaved with Dicer in the presence of 1 at the indicated concentrations and subjected to PAGE analysis. Cleavage of pre-miR-544 at uracil 21 in the purported Dicer site was 50% protected in the presence of 20 nM of 1. (d) Dissimilarity measure (Pearson correlation coefficient) of miRNA microarray data for hypoxic MDA-MB-231 cells treated with 1 vs miR-544 antagomir. Dots represent gene counts (normalized intensity values) of at least 50. (e) Dissimilarity measure (Pearson correlation coefficient) of gene microarray data for hypoxic MDA-MB-231 cells treated with 1 vs miR-544 antagomir. Dots represent genes counts (normalized intensity values) of at least 50.
