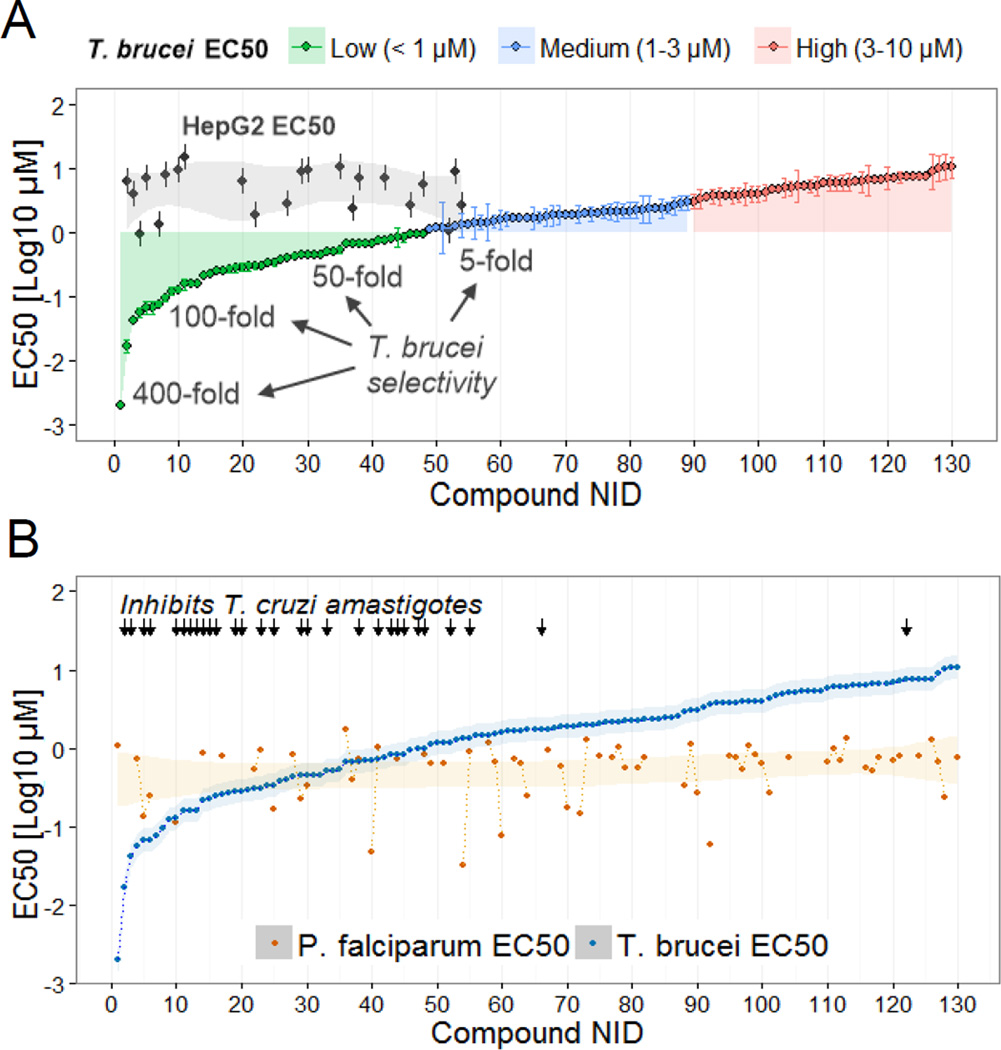
Fig 3. Effective and selective inhibitors of trypanosome growth.
A) EC50s of 130 compounds against T. brucei BFs. Compounds are grouped according to low (green), medium (blue) and high (red) EC50 values. Compounds have a numerical ID (NID) to facilitate identification (details in Table S1). The EC50s of a subset of compounds tested against HepG2 cells are shown (black dots in gray area) and the selectivity range is indicated. B) Plot of T. brucei and P. falciparum 3D7 EC50s. P. falciparum EC50s were obtained from (Gamo, et al., 2010). Compounds effective against T. cruzi intracellular amastigotes at 5 µM are indicated with black arrows. Shading shows EC50 trends. Data are represented as mean ± SEM.

