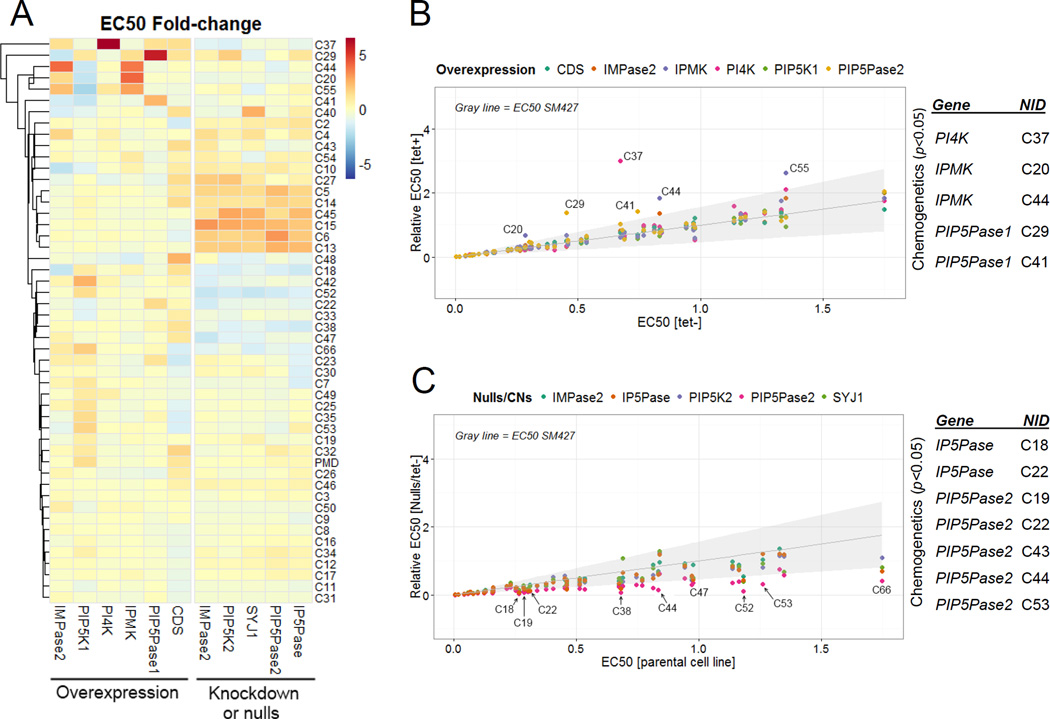
Fig 4. Chemogenetic analysis.
A) Heatmap showing fold changes in compound sensitivity of overexpressing or null/CN cell lines compared to parental (SM427) or noninduced cells. The subset of compounds with EC50 <~1.5 µM was used for analysis. PMD, pentamidine. B–C) Fold EC50 changes for each compound in each overexpressing cell line (B) or CN/null cell line (C). A FDR of 1% was used as a cutoff (gray shading). NIDs are indicated for some compounds which EC50 changes. A list of compounds and genes showing significant changes by chemogenetic analysis with p ≤ 0.05 by ANOVA are shown on the right of each graph (see details in Table S2). Data are represented as mean.

