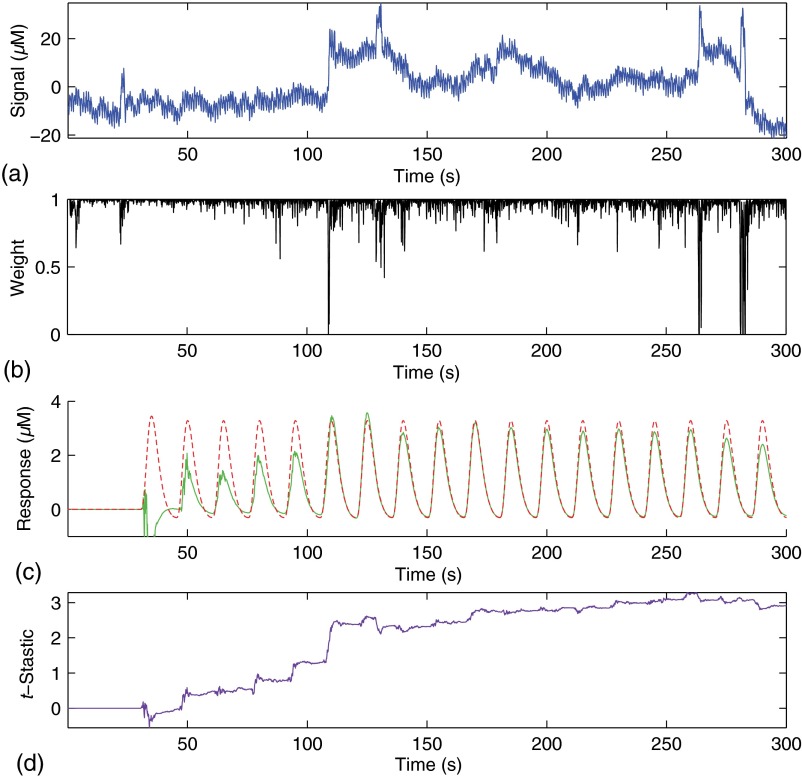
Fig. 3.
(a) An example of simulated fNIRS data from resting-state data and synthetic hemodynamic response. (b) Weights calculated by the algorithm. Artifactual time points are down-weighted. (c) The predicted evoked response (solid green) is shown over the simulated evoked response (dashed red). (d) Evolution of the -statistic over time. Note the difference in scale between (a) and (c). Data are simulated at a contrast-to-noise level of 1:1.

